Sandbox Environment
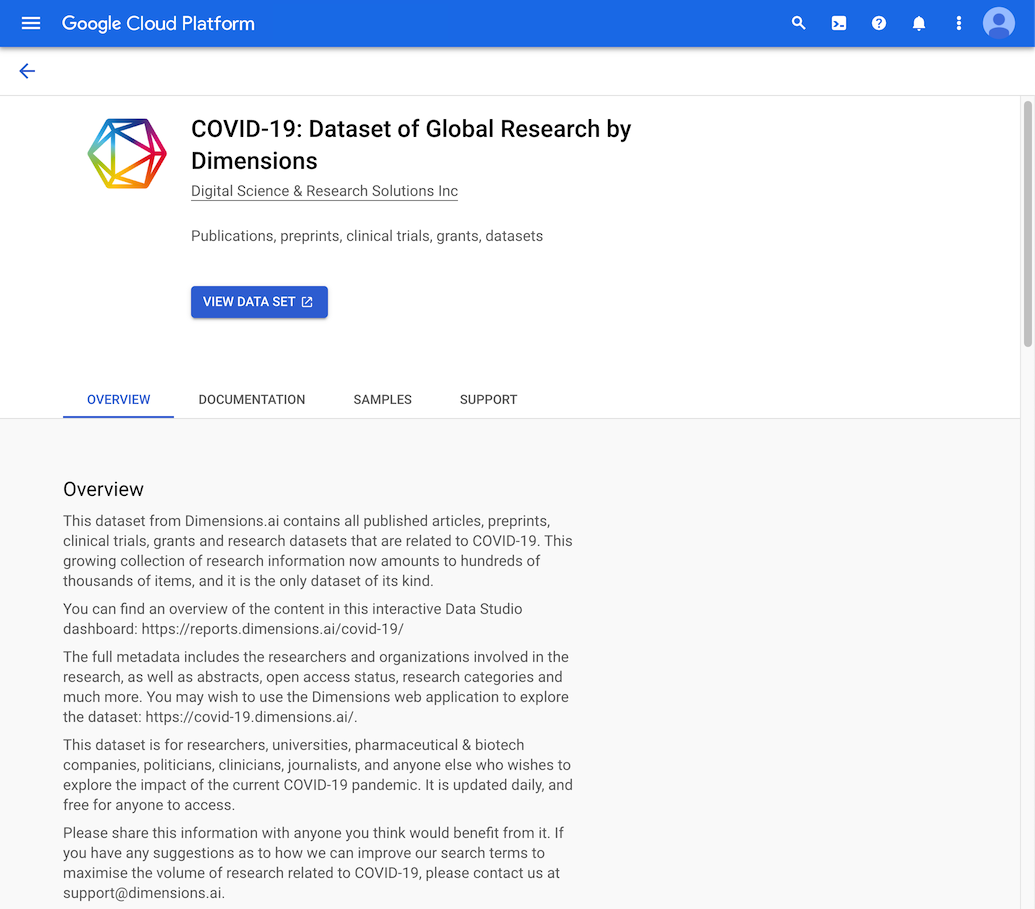
Our COVID-19 dataset dataset is openly available on the Google Cloud Marketplace, and contains all published articles and preprints, grants, clinical trials, and research datasets from Dimensions.ai that are related to COVID-19.
The dataset can be used as a sandbox environment for the larger Dimensions.ai dataset, as well as for Covid-19 research.
At time of writing (Feb 2021), the dataset contains:
300k+ publications and preprints
5000+ grants worth £4.5bn+
8000+ clinical trials
10k+ research datasets
100k+ research organizations
Hint
The dataset is growing every day. You can see the latest data in our interactive Covid-19 dashboard, which we built using this dataset and Google’s free Data Studio tool.
With this dataset, you can:
Explore the Dimensions data schema for publications, grants, clinical trials, datasets and organizations. The schema for these content types corresponds 100% to the full Dimensions dataset schema. (Note that the full Dimensions dataset also contains patents and researcher tables.)
Query the data: write SQL queries directly in the BigQuery web UI, to get a feel for how Dimensions data works in the BigQuery environment.
Build your own dashboard, using Data Studio or another visualization tool such as Tableau or Qlik.
Join with other proprietary data: such as your own organizational data, or openly available datasets such as ChEMBL or the World Bank Indicators.
Conduct research into Covid-19: our comprehensive dataset is updated daily, and can be used for emerging trends, benchmarking, collaboration analysis and much more.
It is a great way to experience how Dimensions works on the Google BigQuery Platform.
Getting started
Please use our step-by-step guide, which will get you up and running. You can find videos and text descriptions for:
Setting up BigQuery for the first time
Accessing the Dimensions Covid-19 dataset
Familiarising yourself with the Dimensions data schema
Writing a query
Building a dashboard using Data Studio
If you would like to use the Covid-19 data with another visualization tool, then please see separate guides for connecting to BI tools such as Tableau and PowerBI .
For additional questions, please email supportbigquery@dimensions.ai.
Sample queries
Return total number of publications available:
SELECT COUNT(*) as total_pubs
FROM
  `covid-19-dimensions-ai.data.publications`
Retrieve the top 5 records from the publications table which have the highest Altmetric Attention scores in the year 2020. Returning the publication identifier, title of the publication, as well as the Altmetric Attention score:
SELECT id, title, CAST(altmetrics.score as INT64) as altmetric_score
FROM
   `covid-19-dimensions-ai.data.publications`
WHERE
   year = 2020
ORDER BY
   altmetrics.score desc
Retrieve the total number of publications added to Dimensions each month in 2020:
SELECT
   COUNT(*) AS total_pubs,
   EXTRACT(MONTH
   FROM
      date_inserted) AS month
FROM
   `covid-19-dimensions-ai.data.publications`
WHERE
   EXTRACT(YEAR
   FROM
      date_inserted) = 2020
GROUP BY
   month
ORDER BY
   month DESC