How to Unnest JSON Data in Excel
A guide to working with JSON data returned from the Dimensions Add-in for Excel.
Installing the Add-in
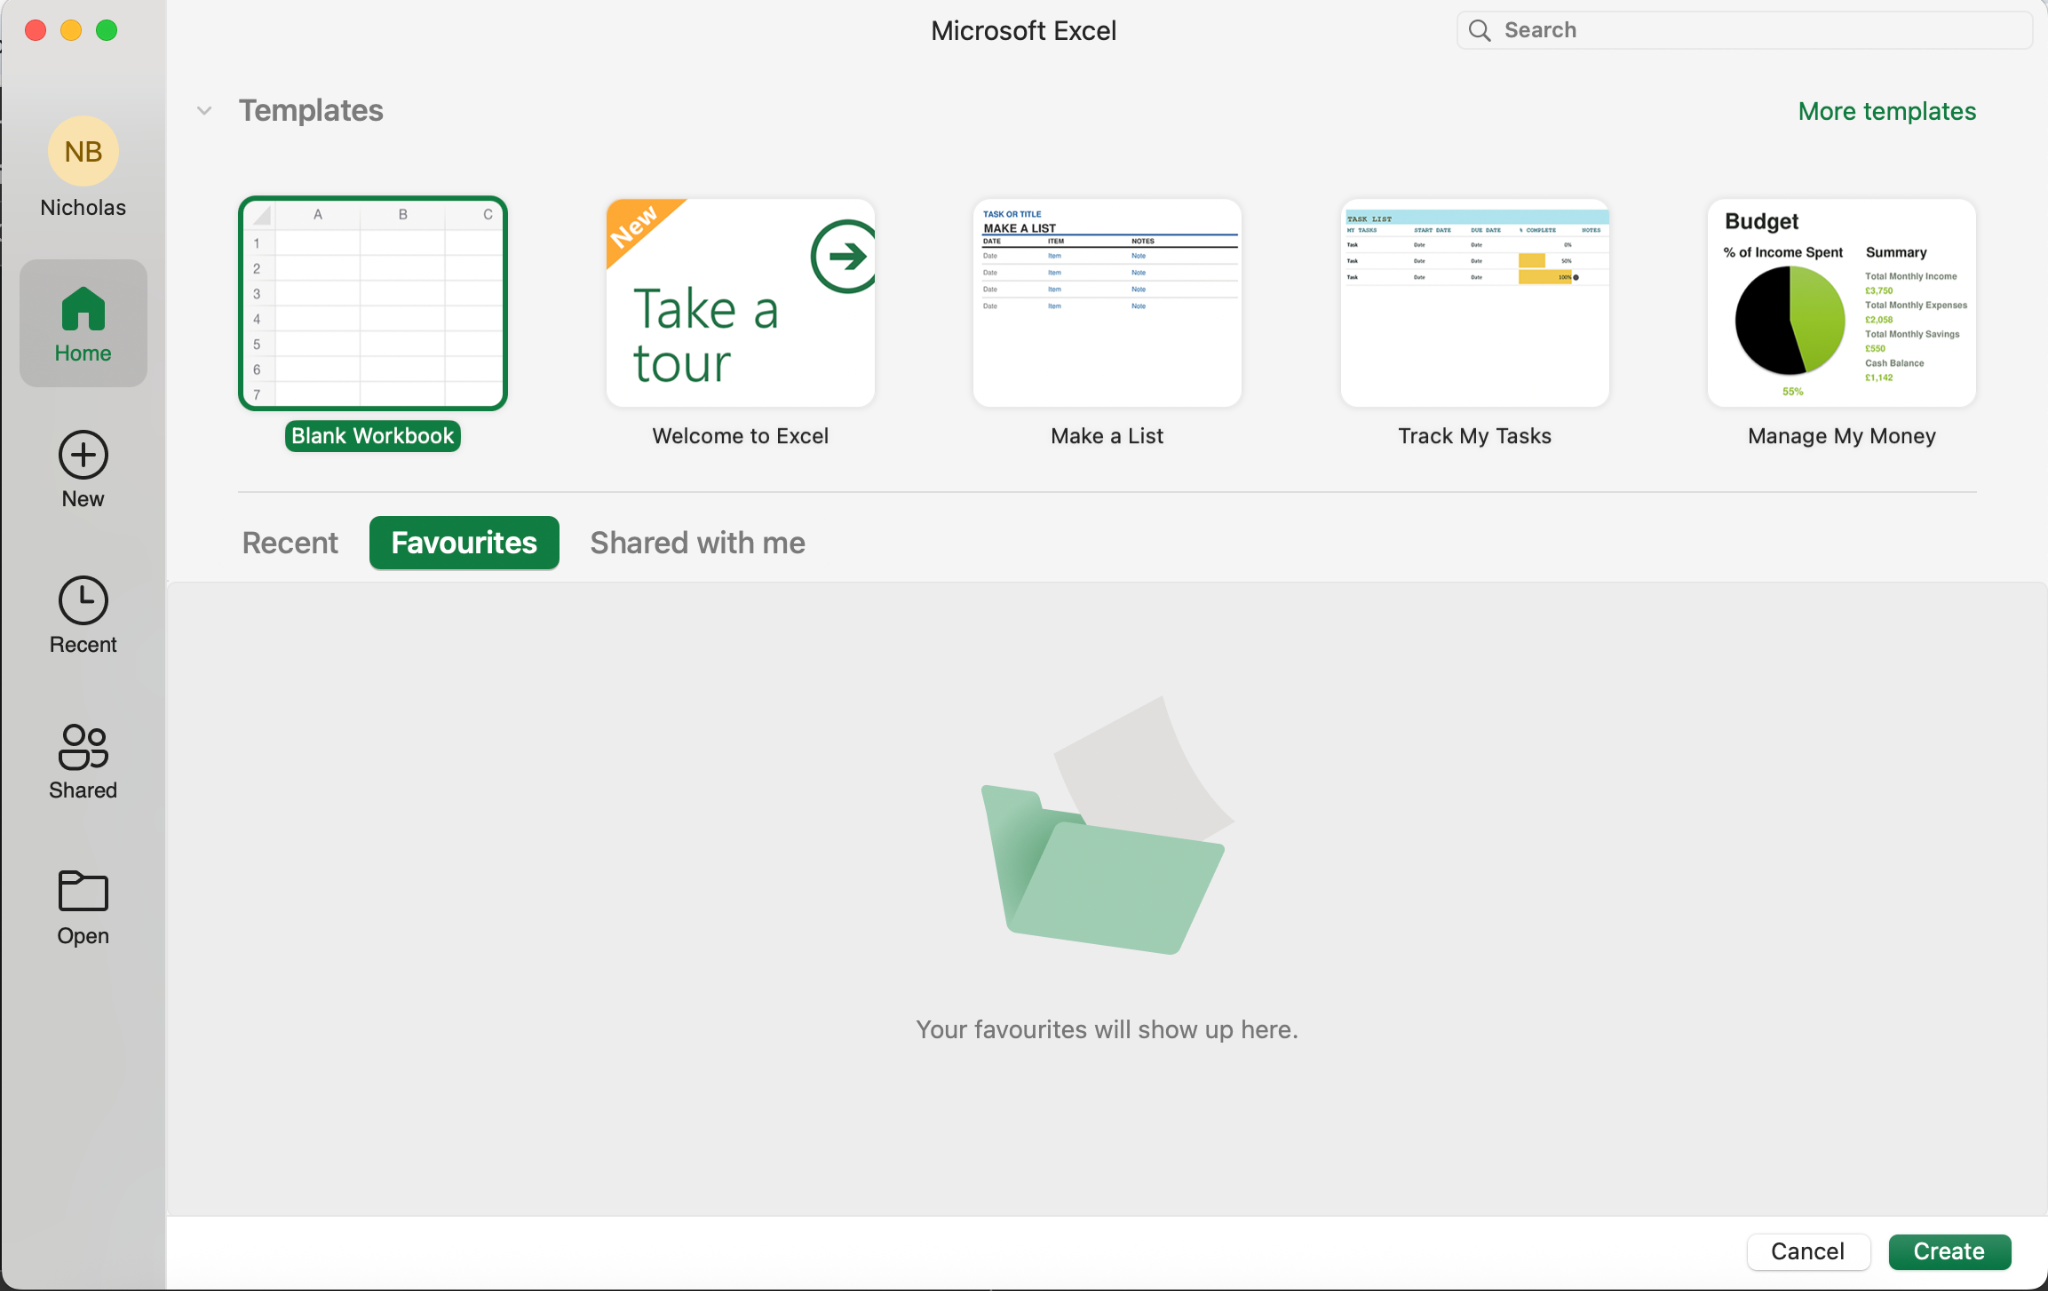
Open Microsoft Excel and start a new, blank workbook.
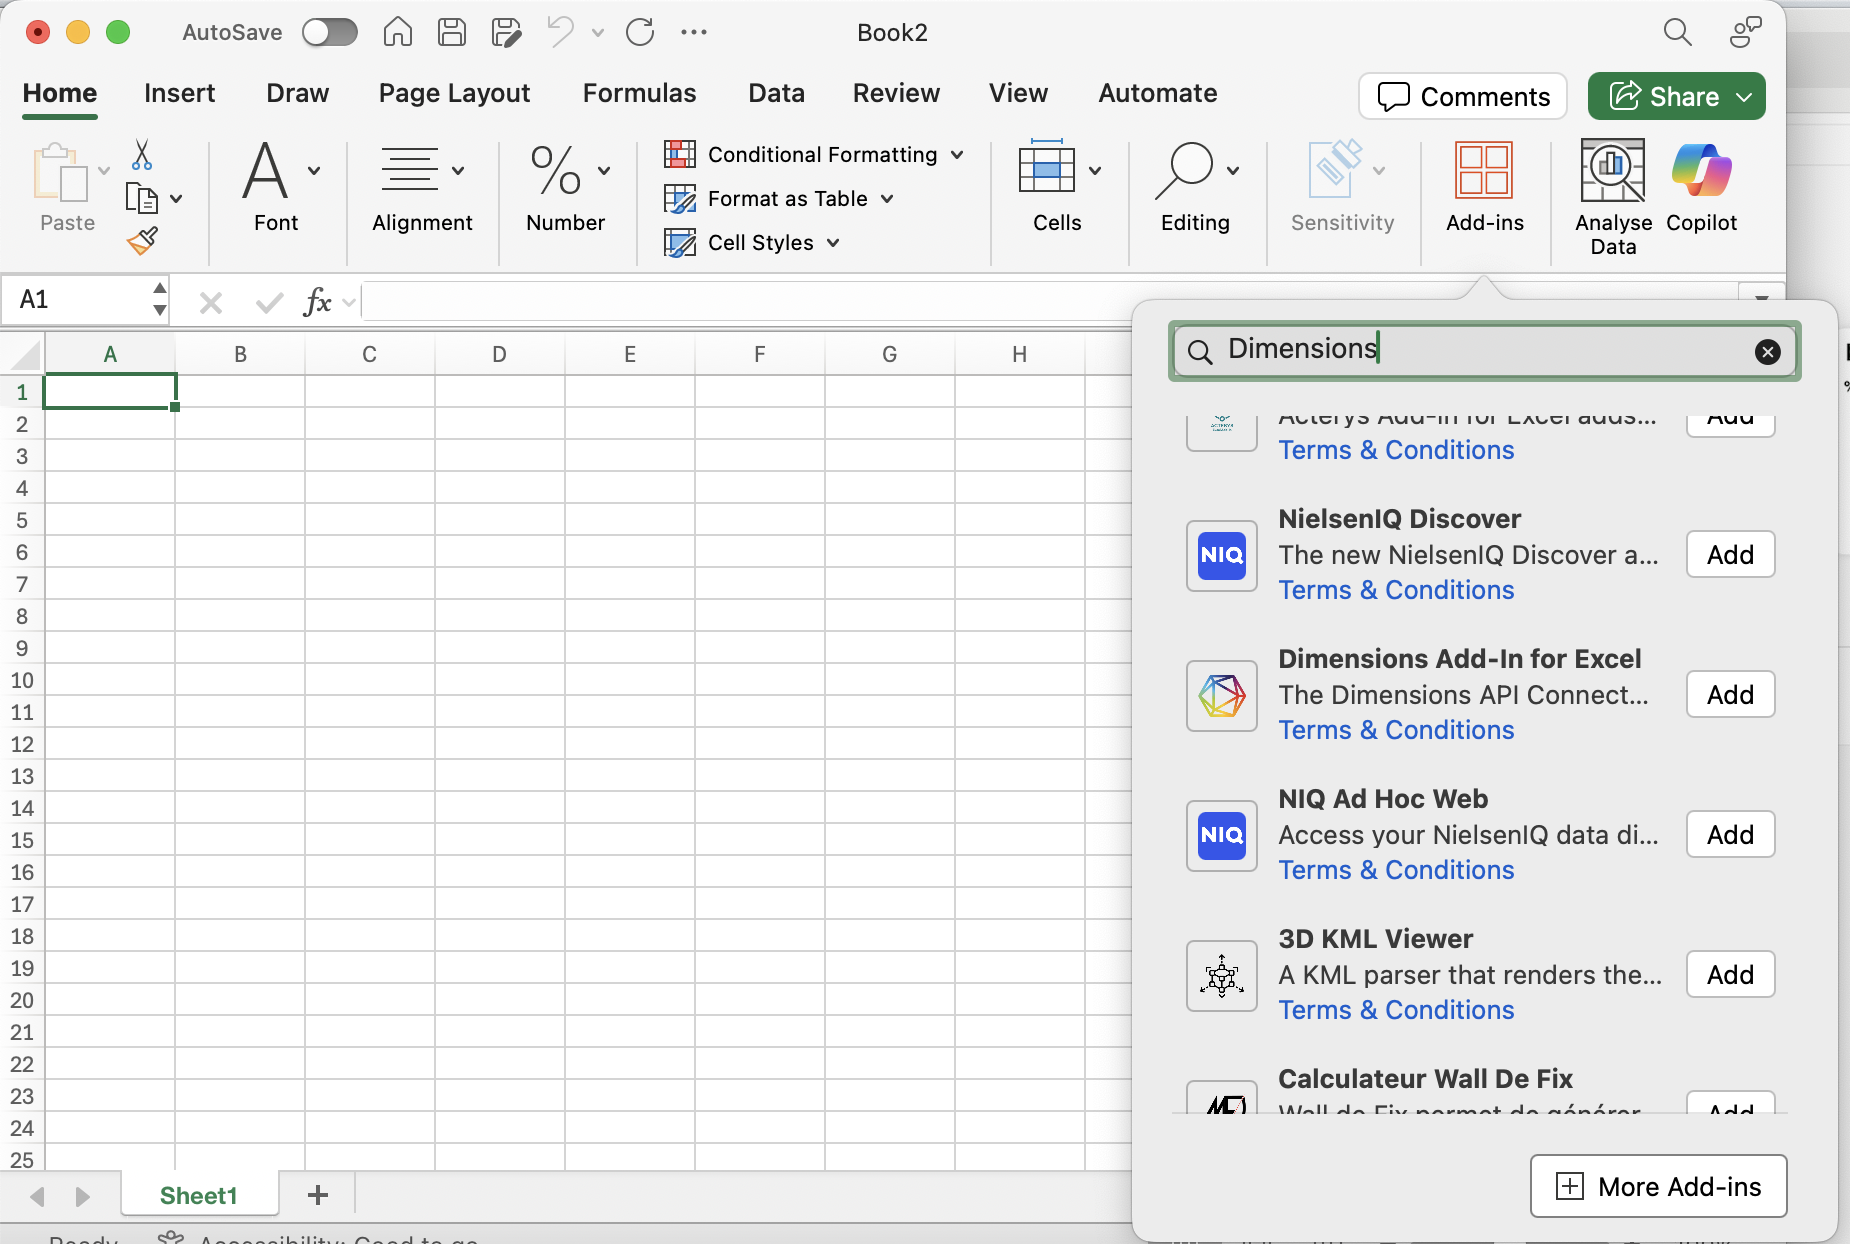
In the Home ribbon, click Add-ins and search for “Dimensions”. Scroll until you see the Dimensions logo.
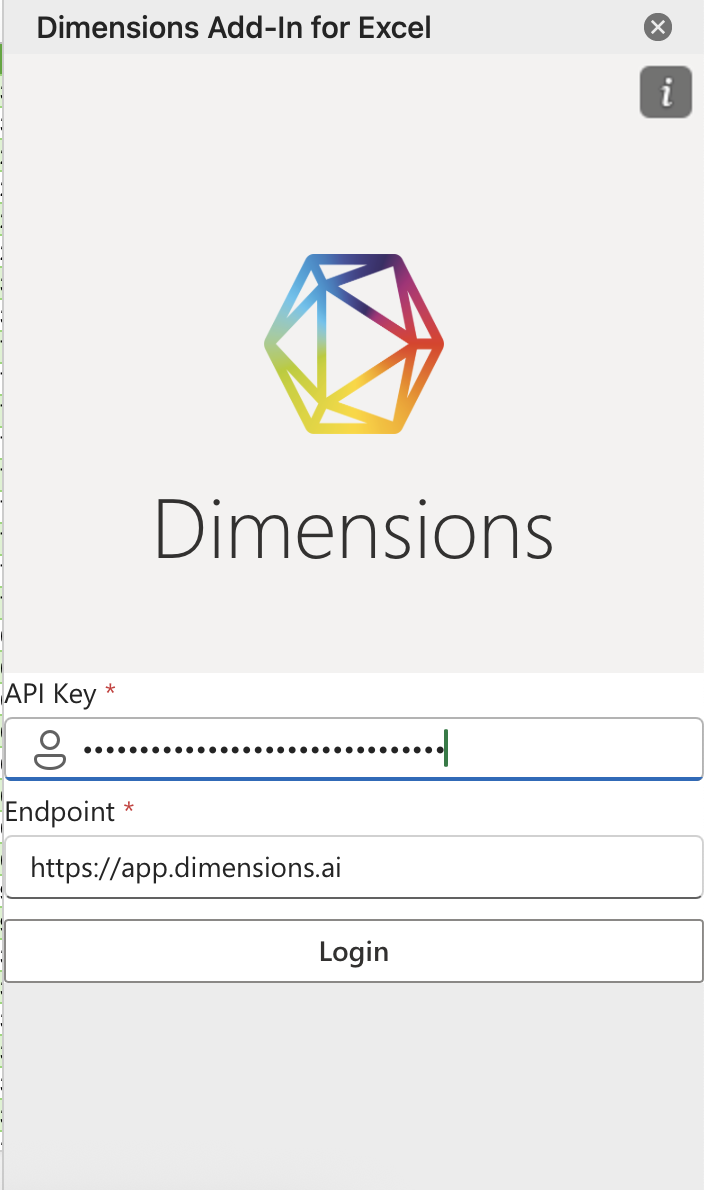
Authenticate (or open the Add-in later from the Data ribbon).
Enter your API key and click Login. Keep Endpoint as default unless you have a reason to change it.
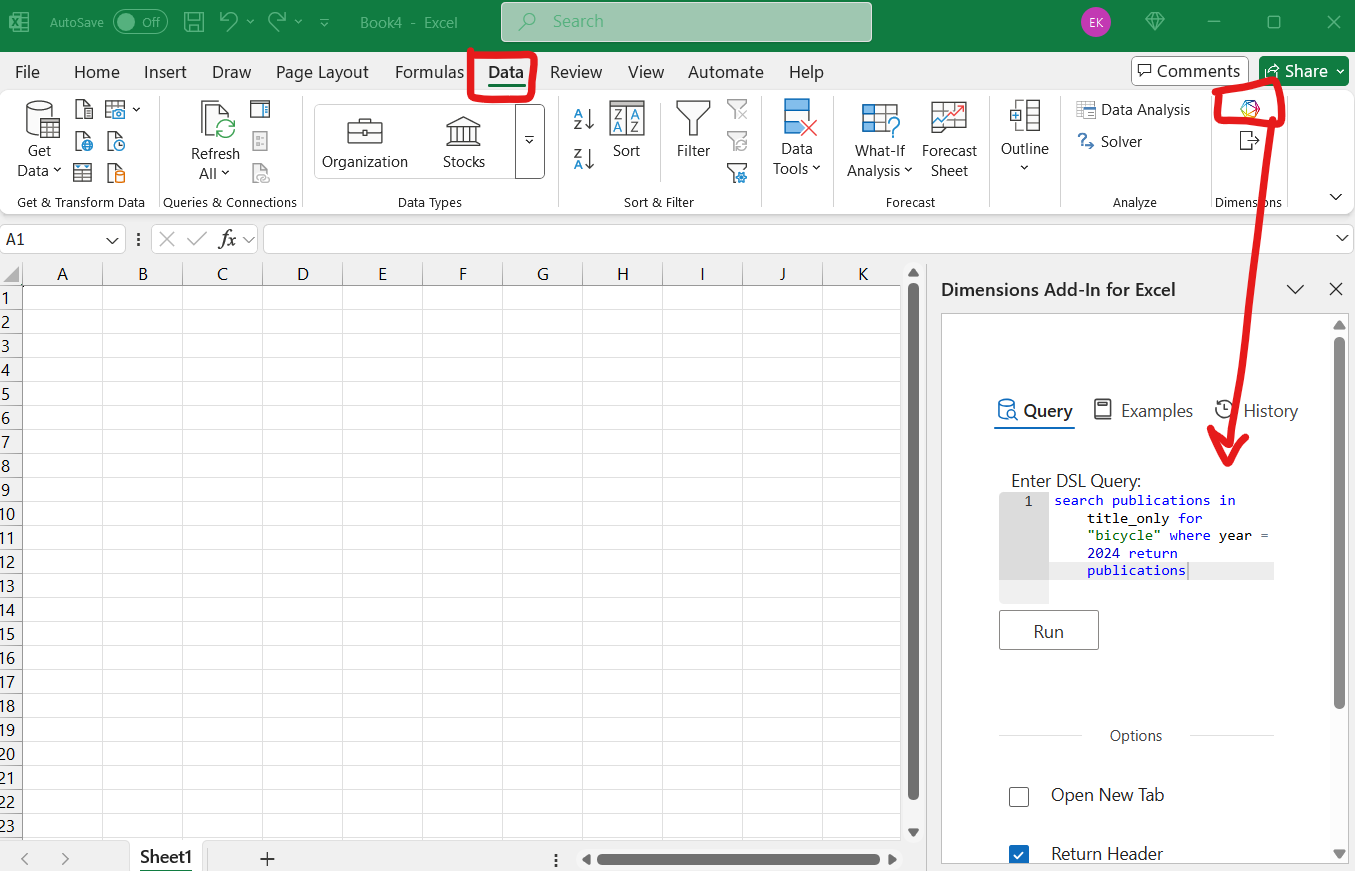
Running a Query
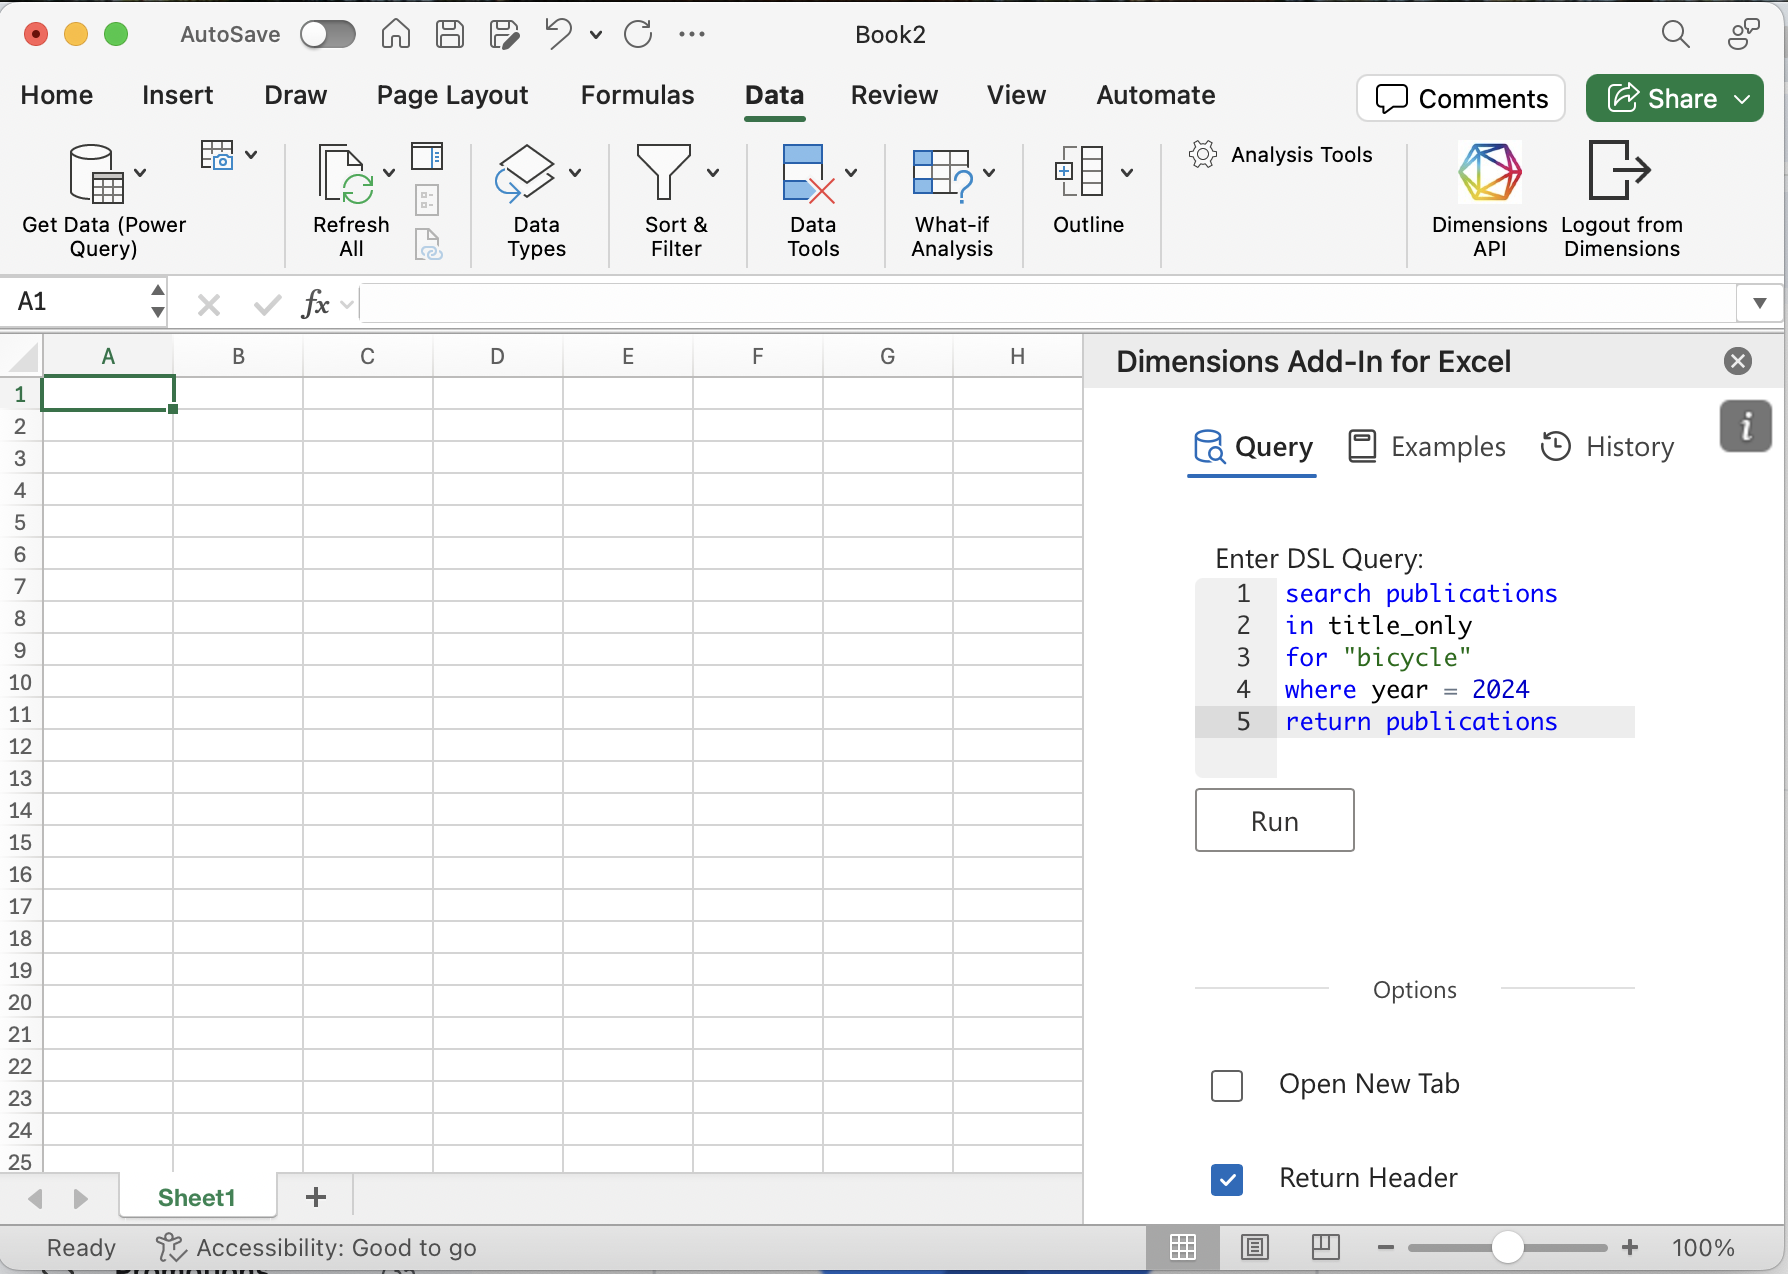
Select a target cell/sheet, type a query, and click Run.
Note
Before unnesting JSON columns, save the workbook.
Unnesting JSON (macOS)
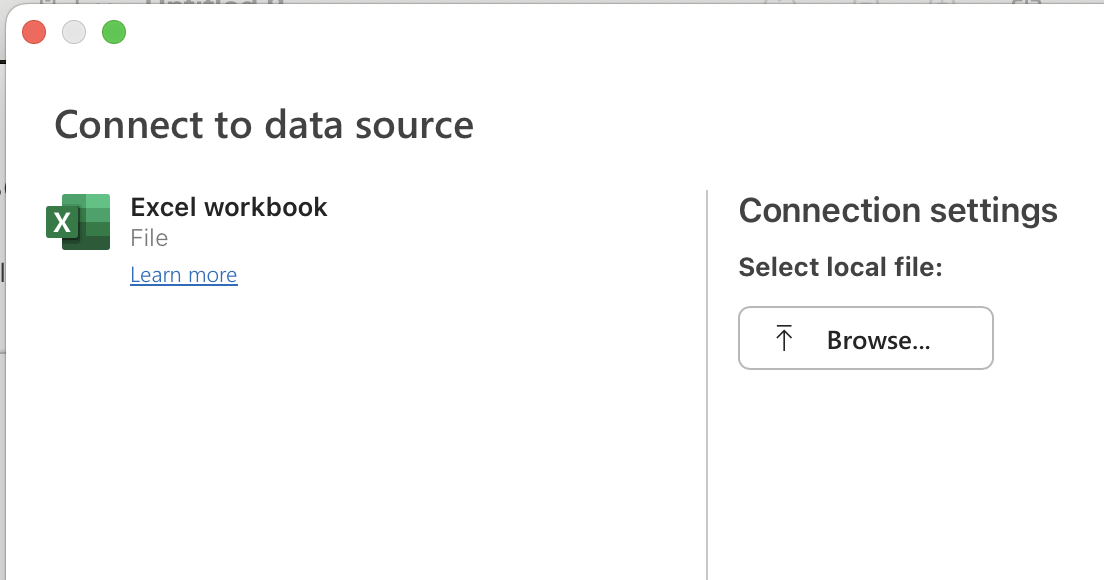
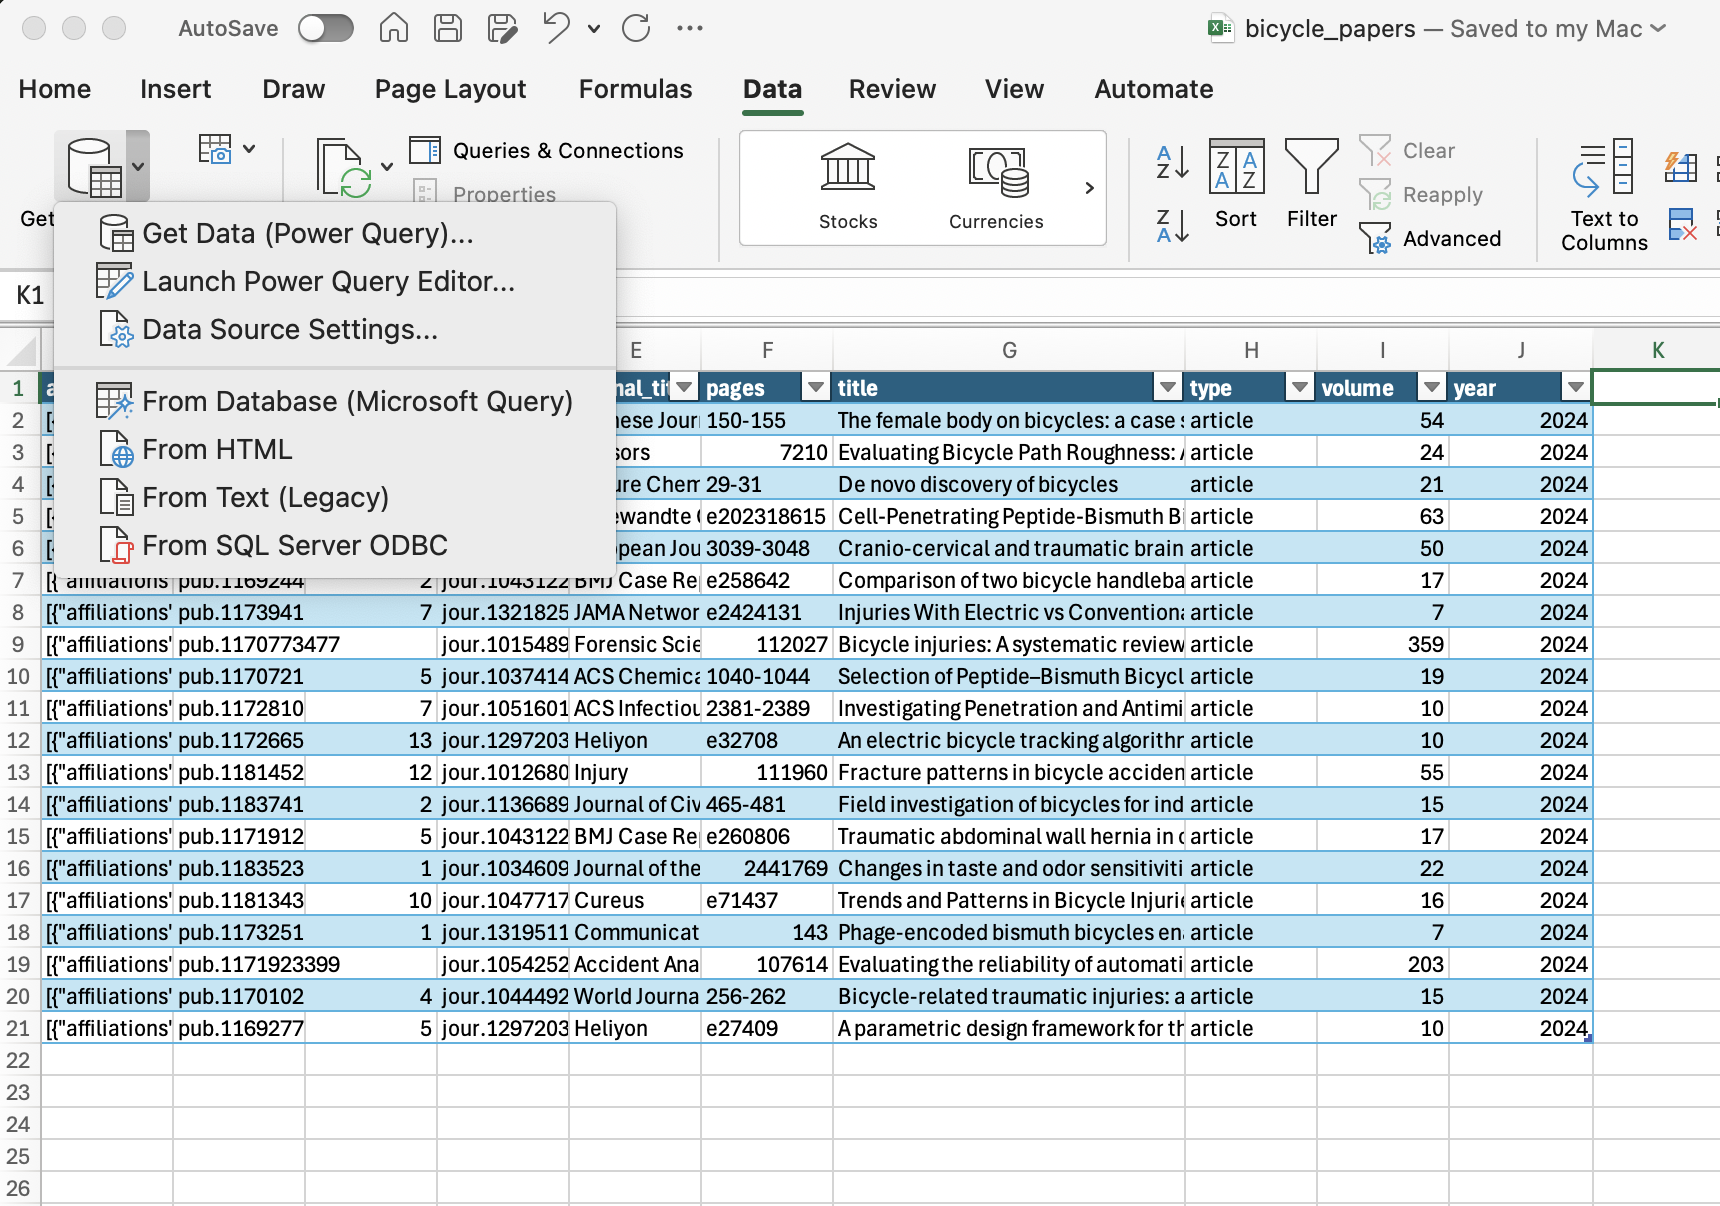
Data ribbon → Get Data dropdown → Get Data (Power Query)…
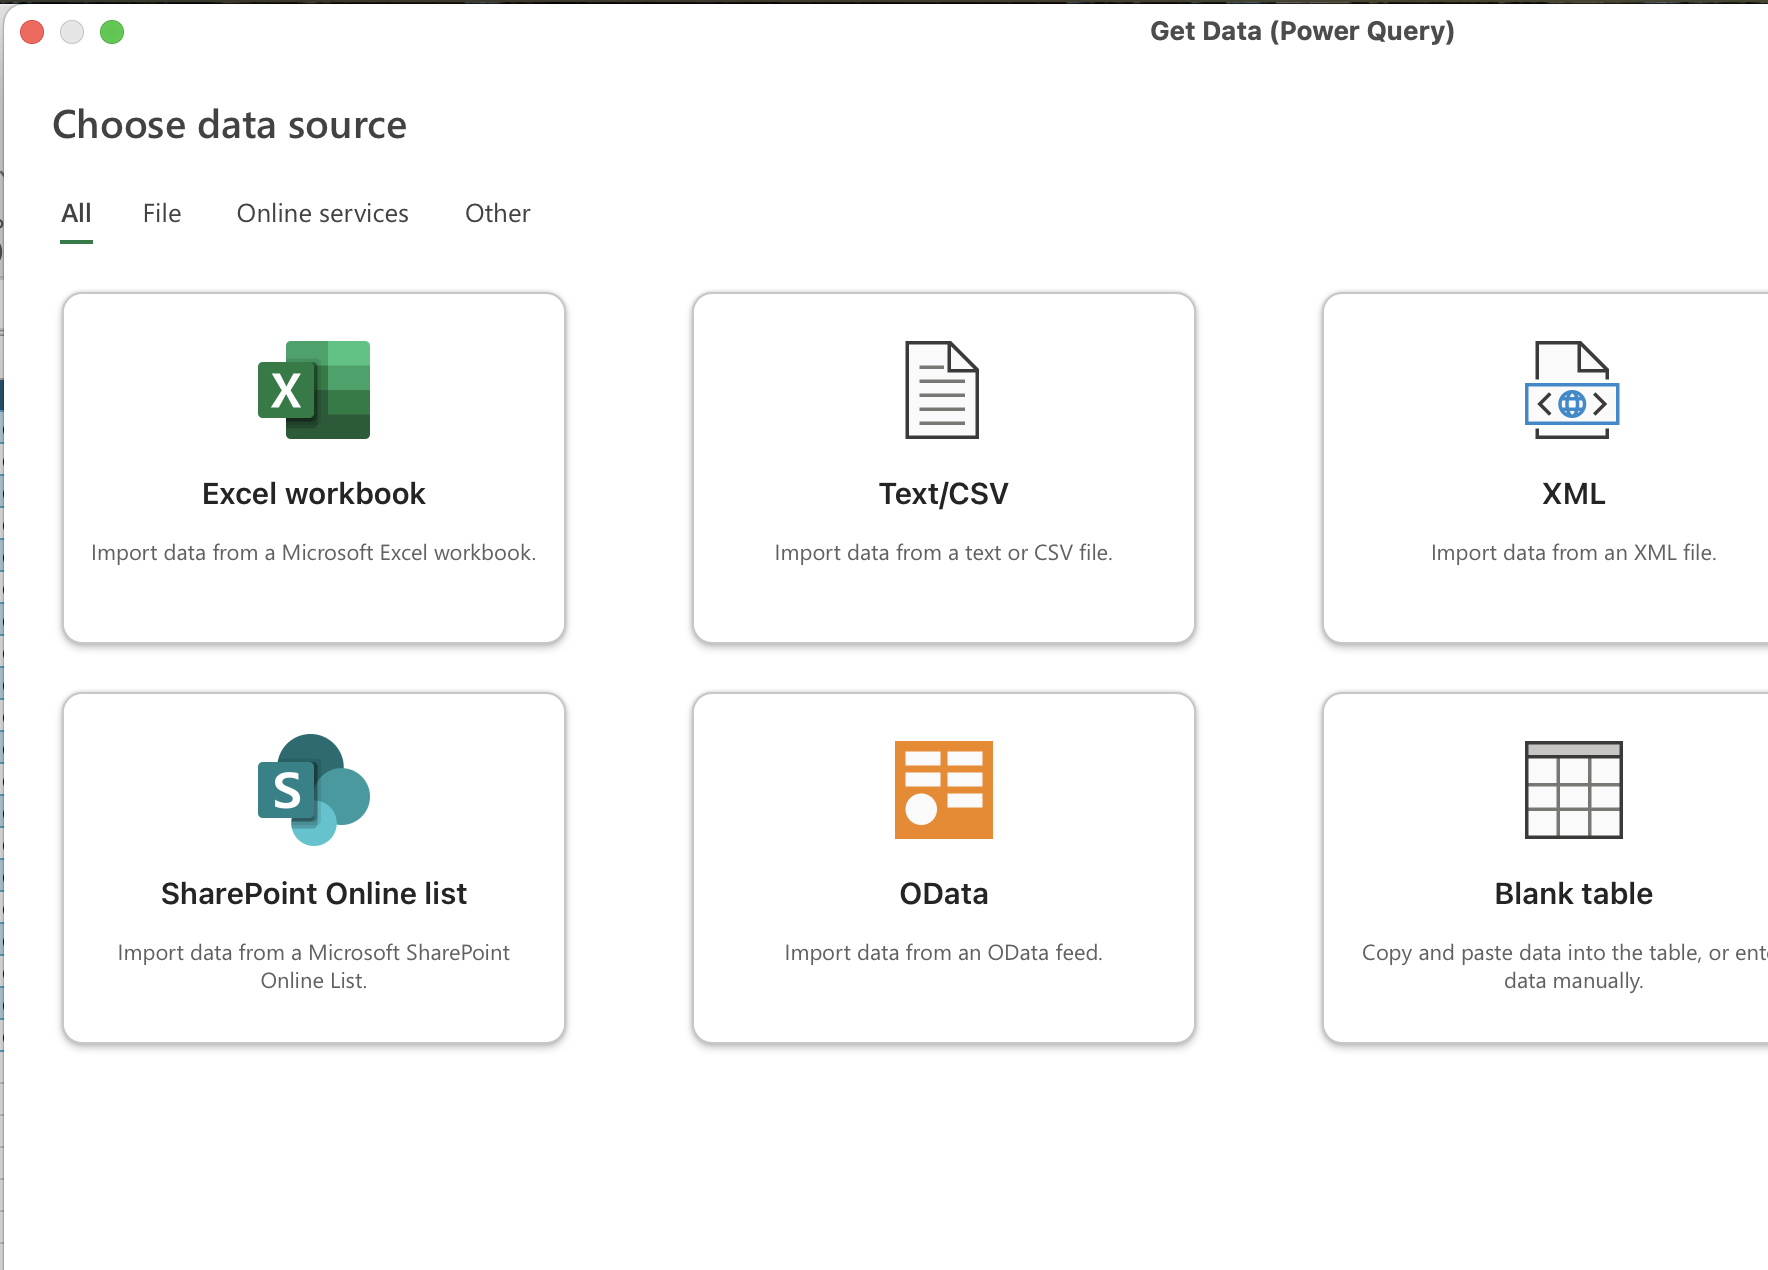
Choose Excel workbook as the data source.
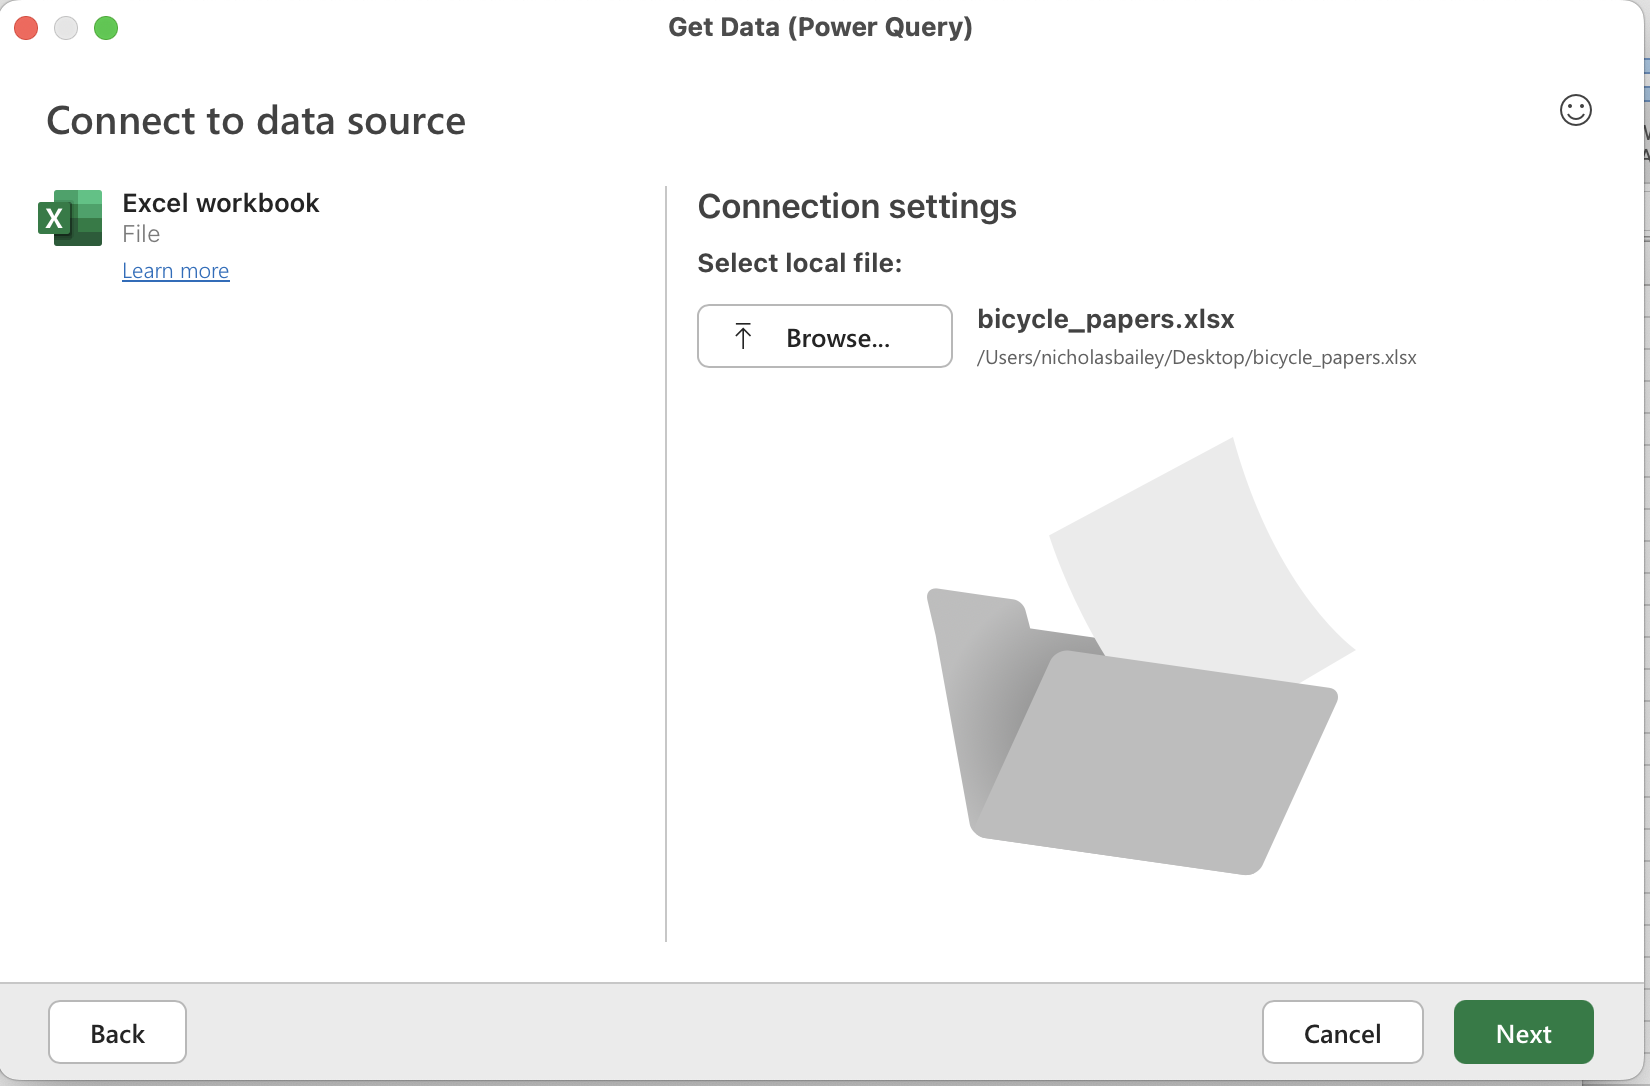
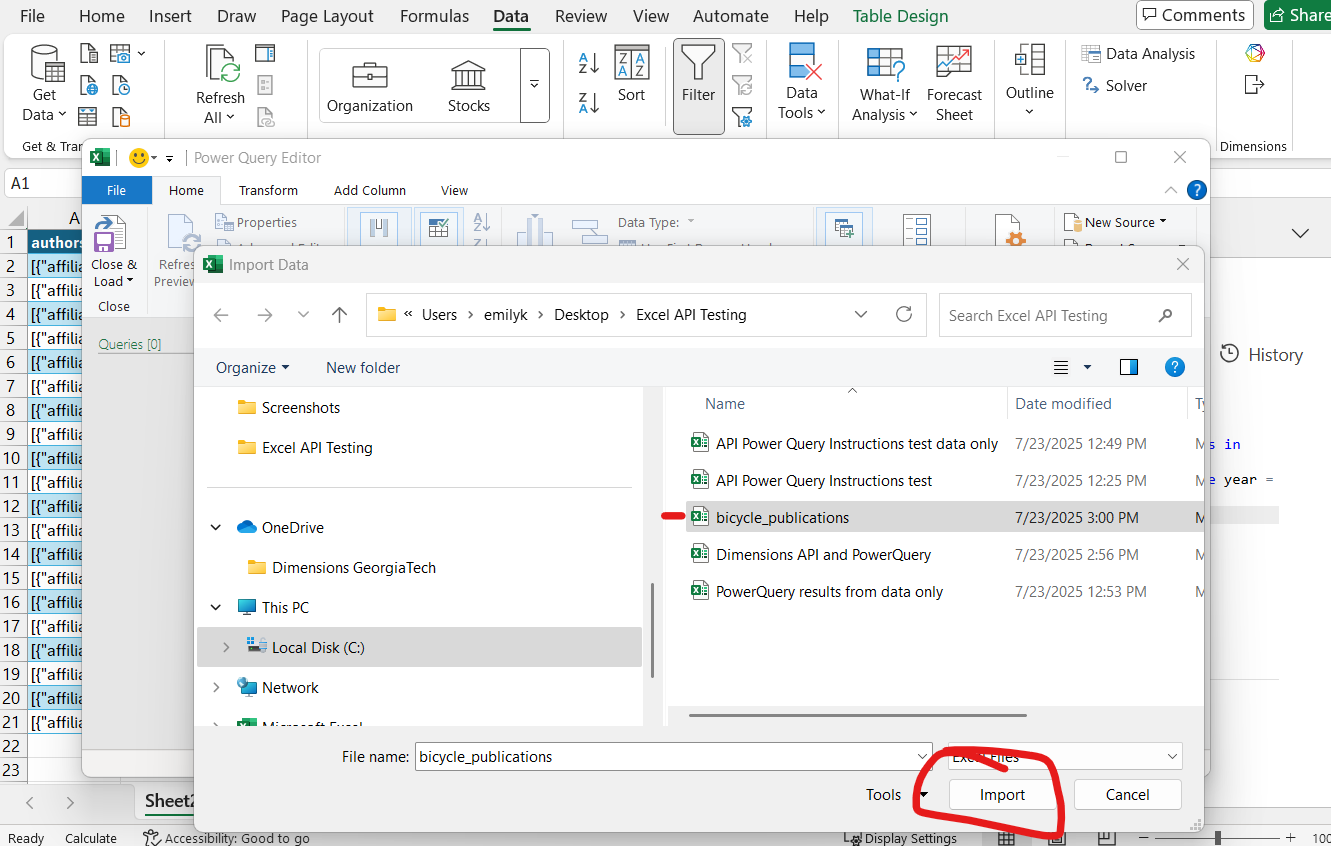
Browse for the workbook you saved and click Next.
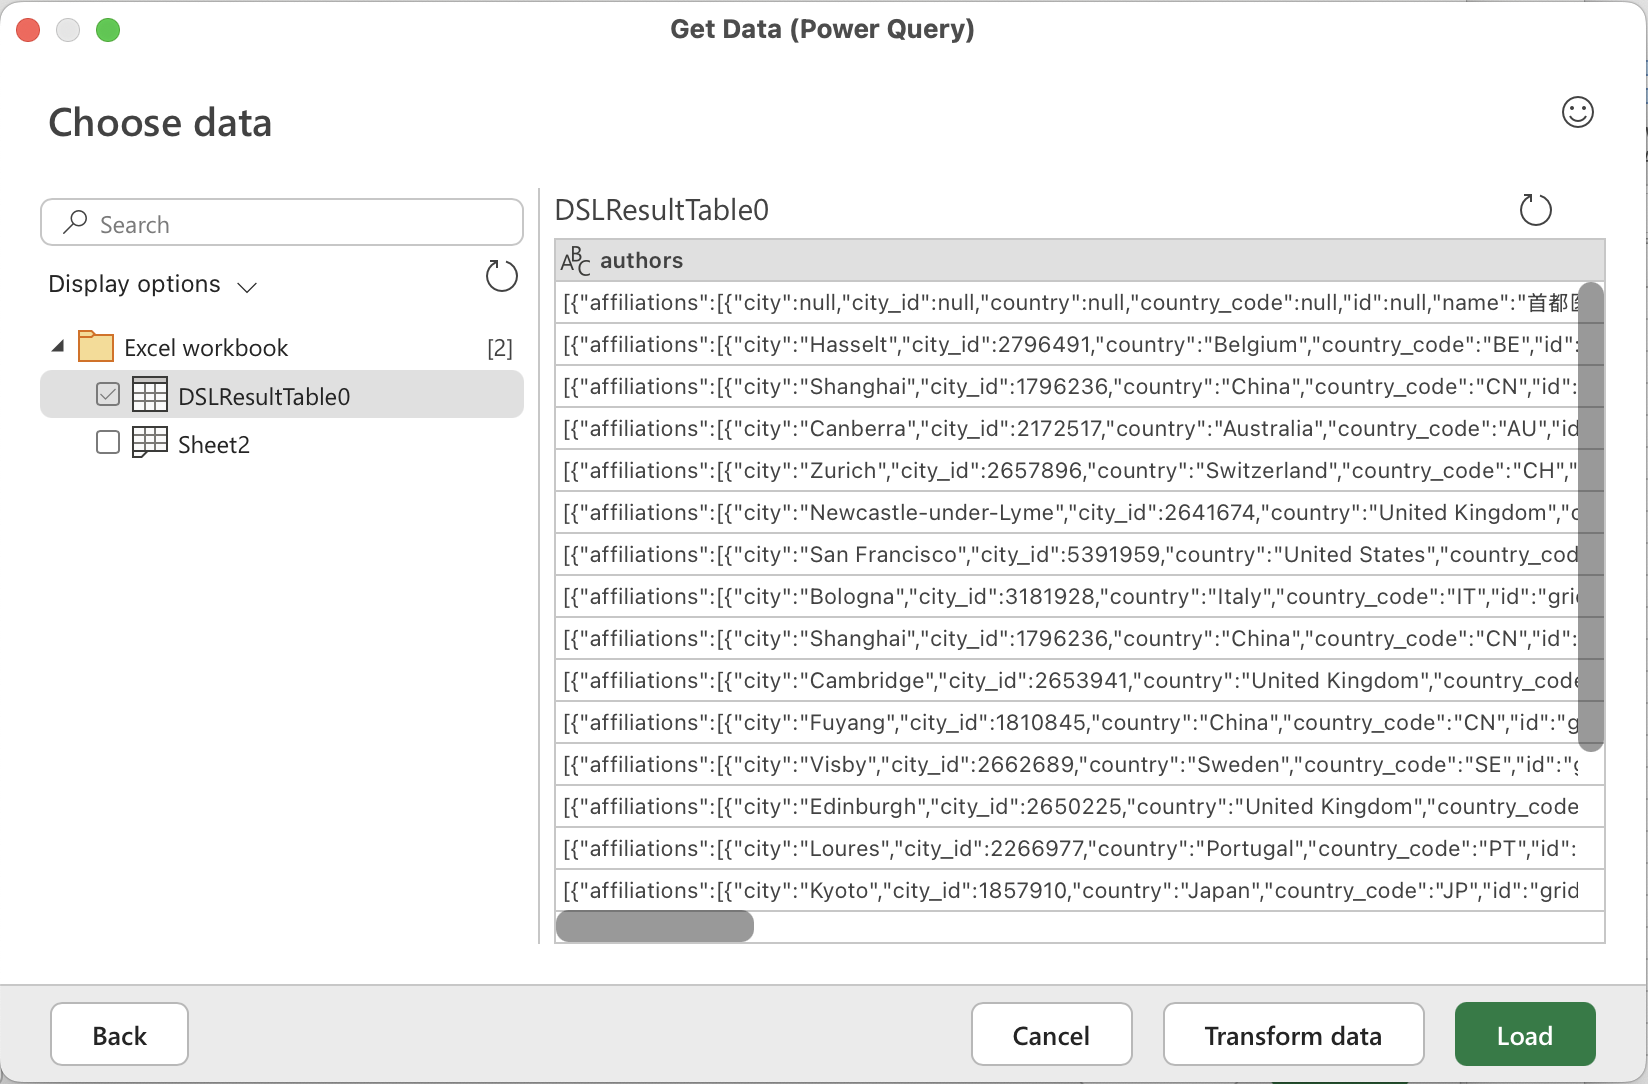
Preview loads → click Transform Data.
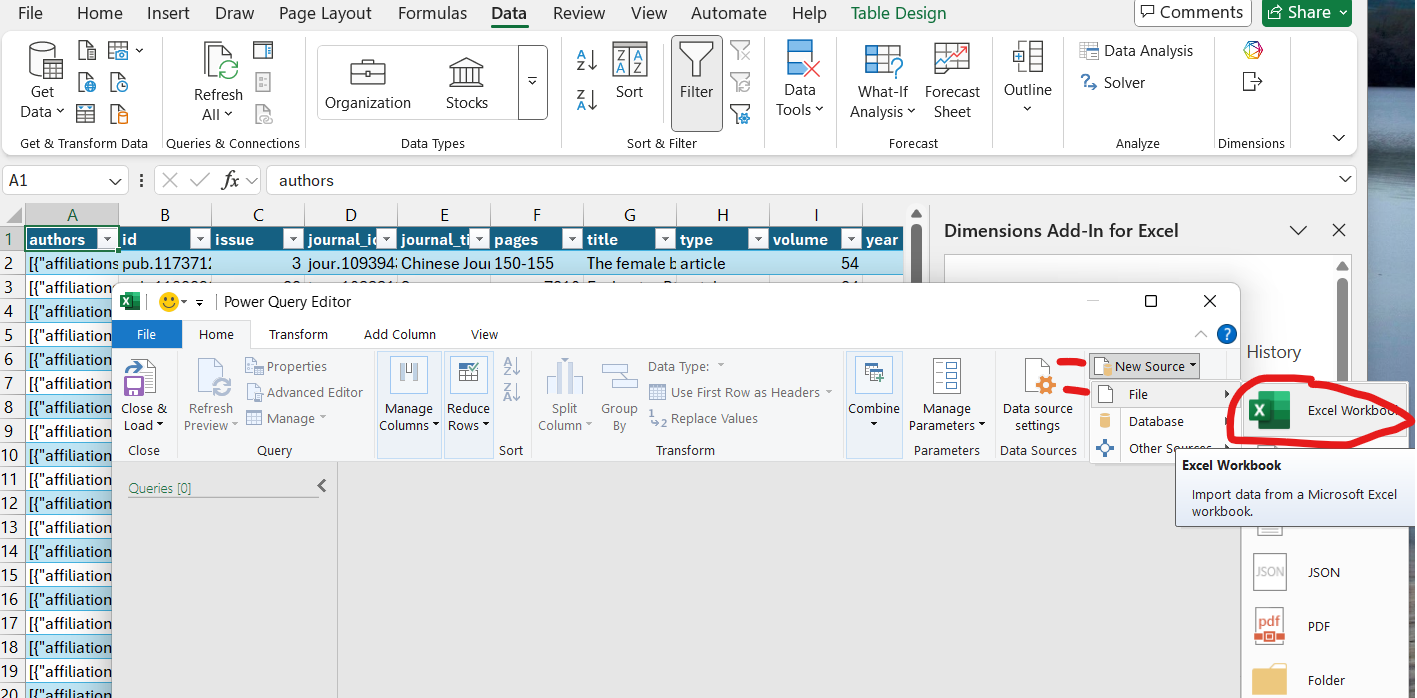
Unnesting JSON (Windows)
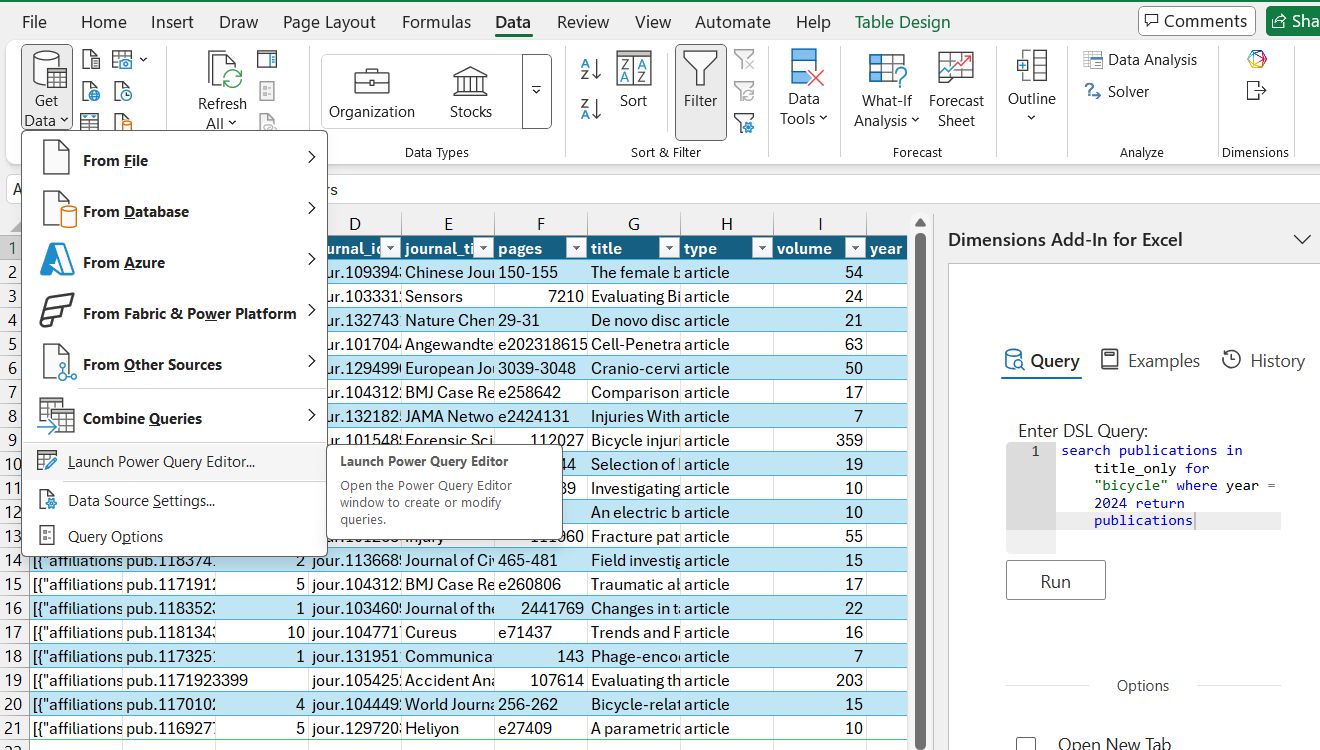
Data ribbon → Get Data dropdown → Launch Power Query.
Choose Excel workbook as the data source.
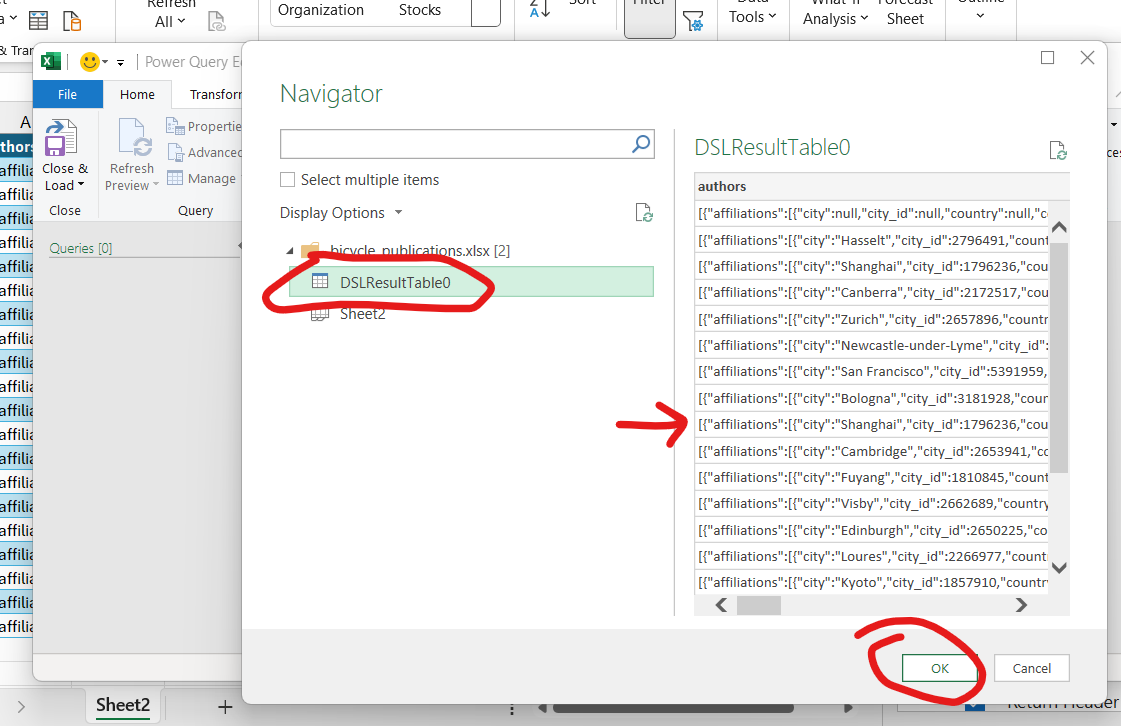
Browse for the saved workbook, select DSL Query to preview, click OK.
Working in Power Query
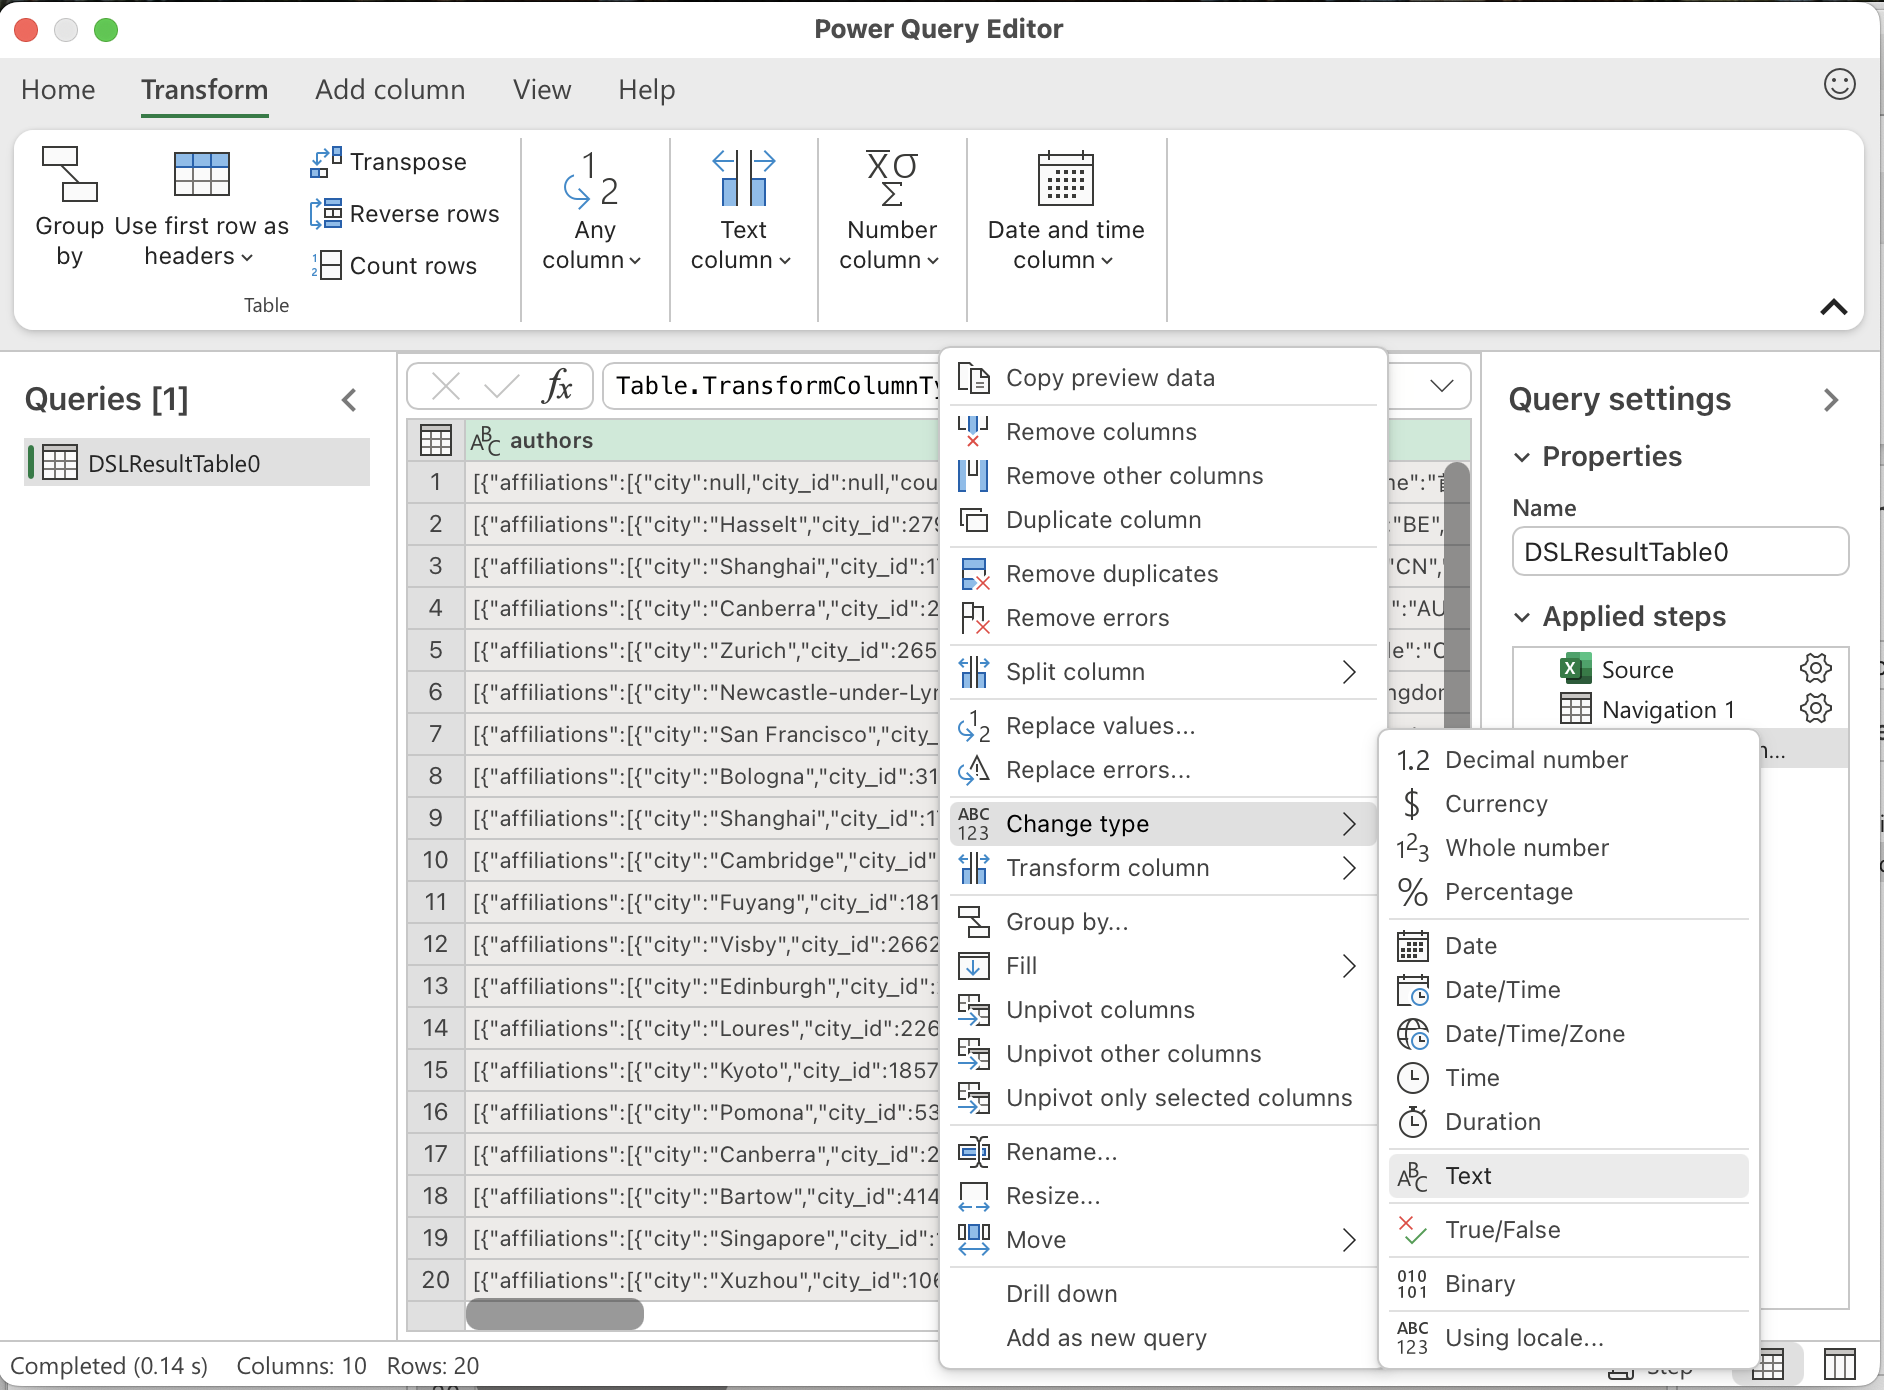
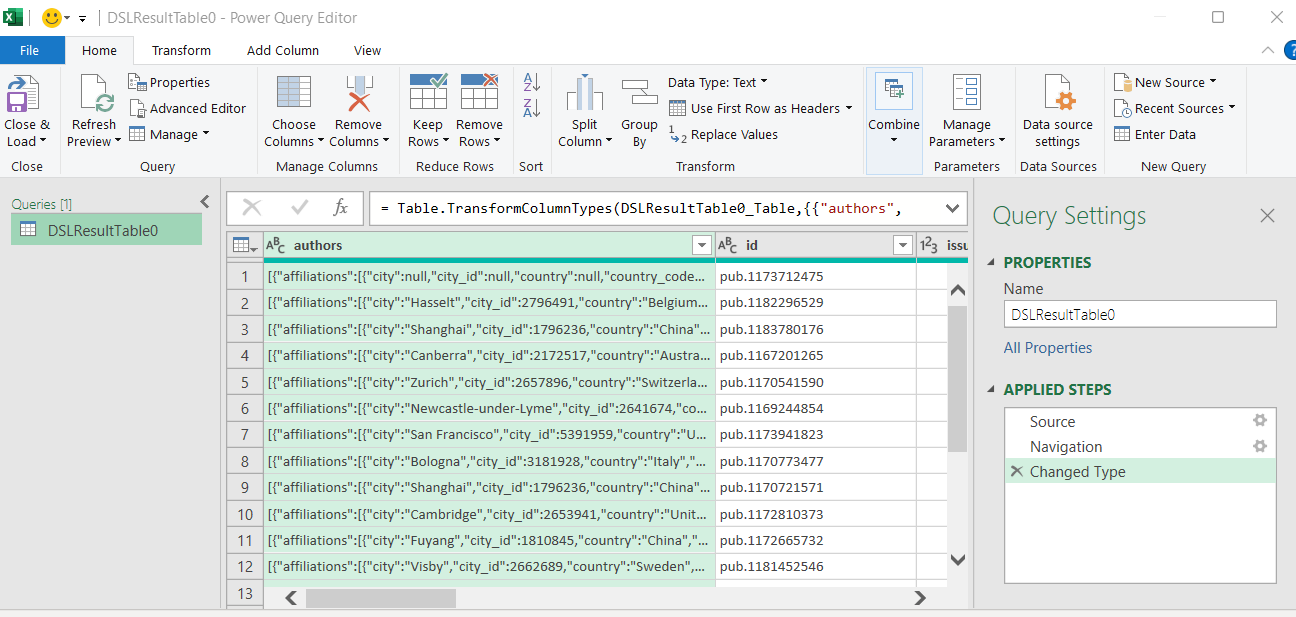
In Power Query Editor, right-click the JSON column → Change Type → Text.
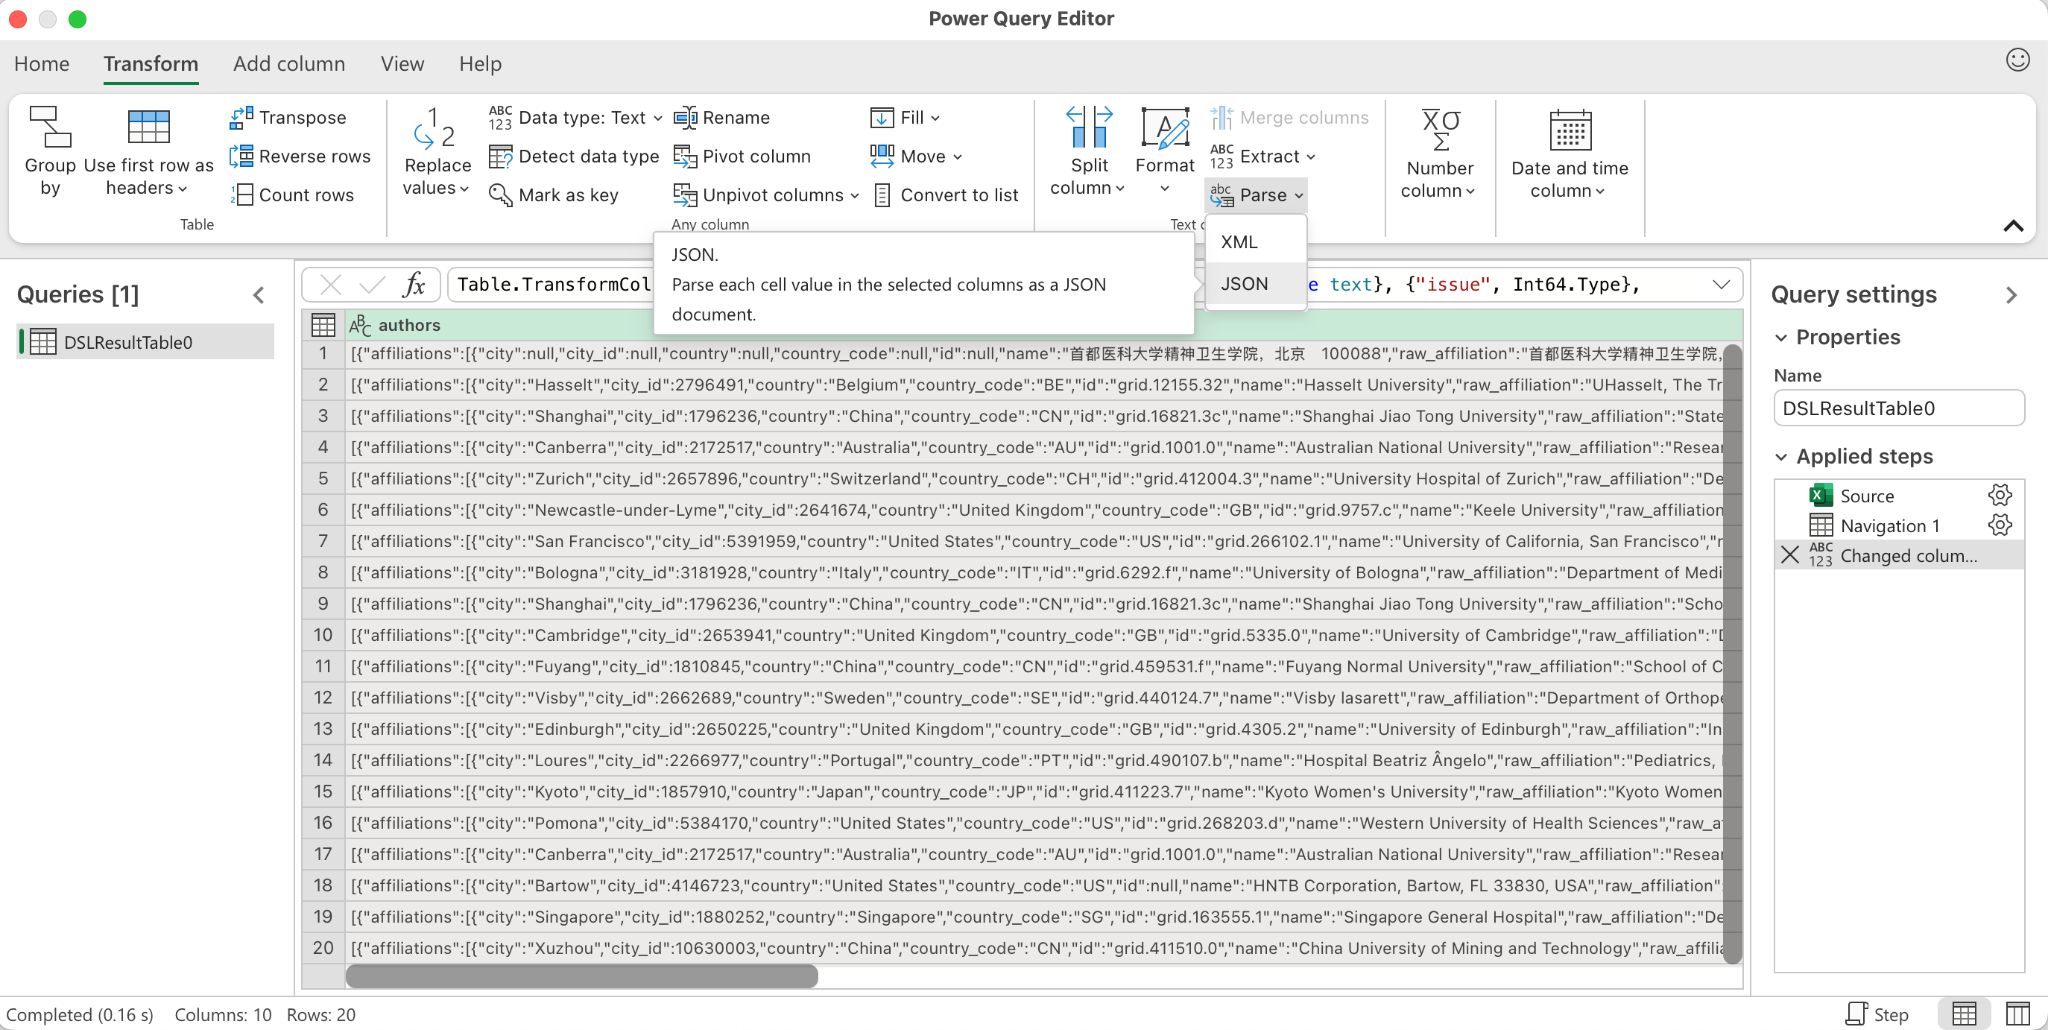
With the column selected: Transform ribbon → Parse → JSON.
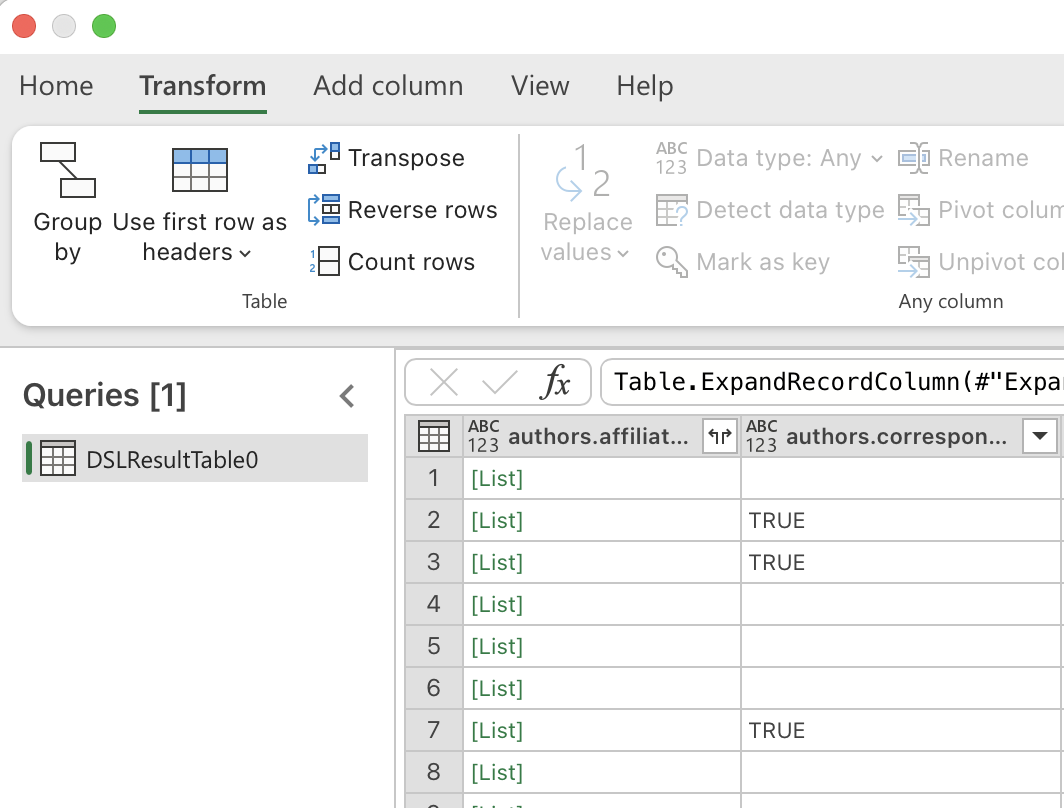
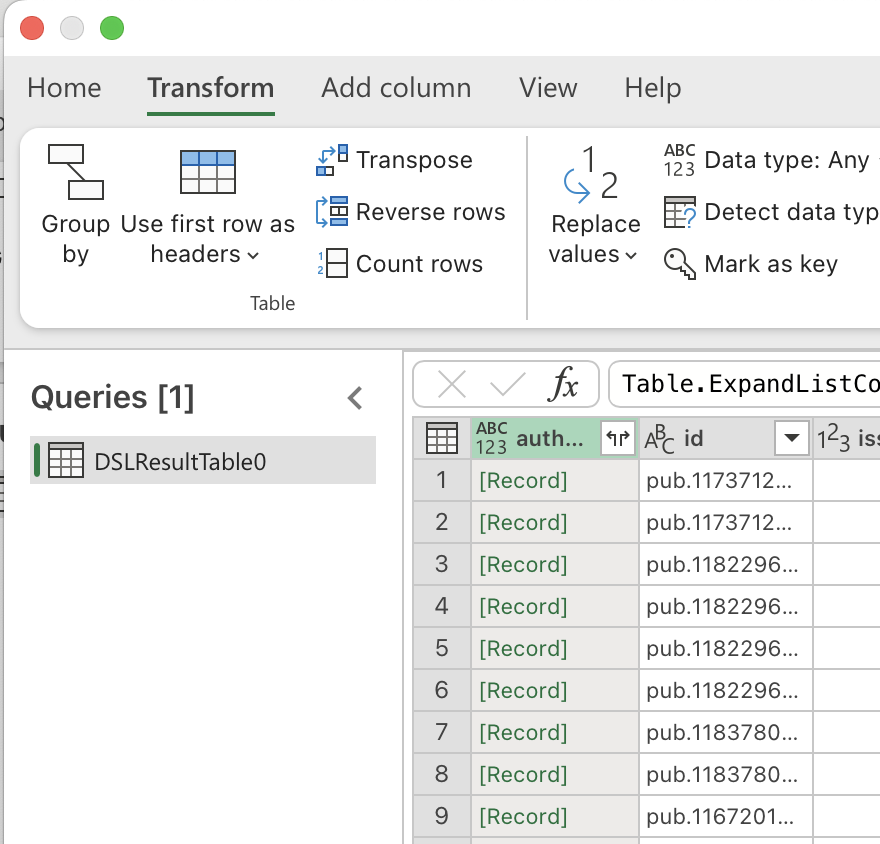
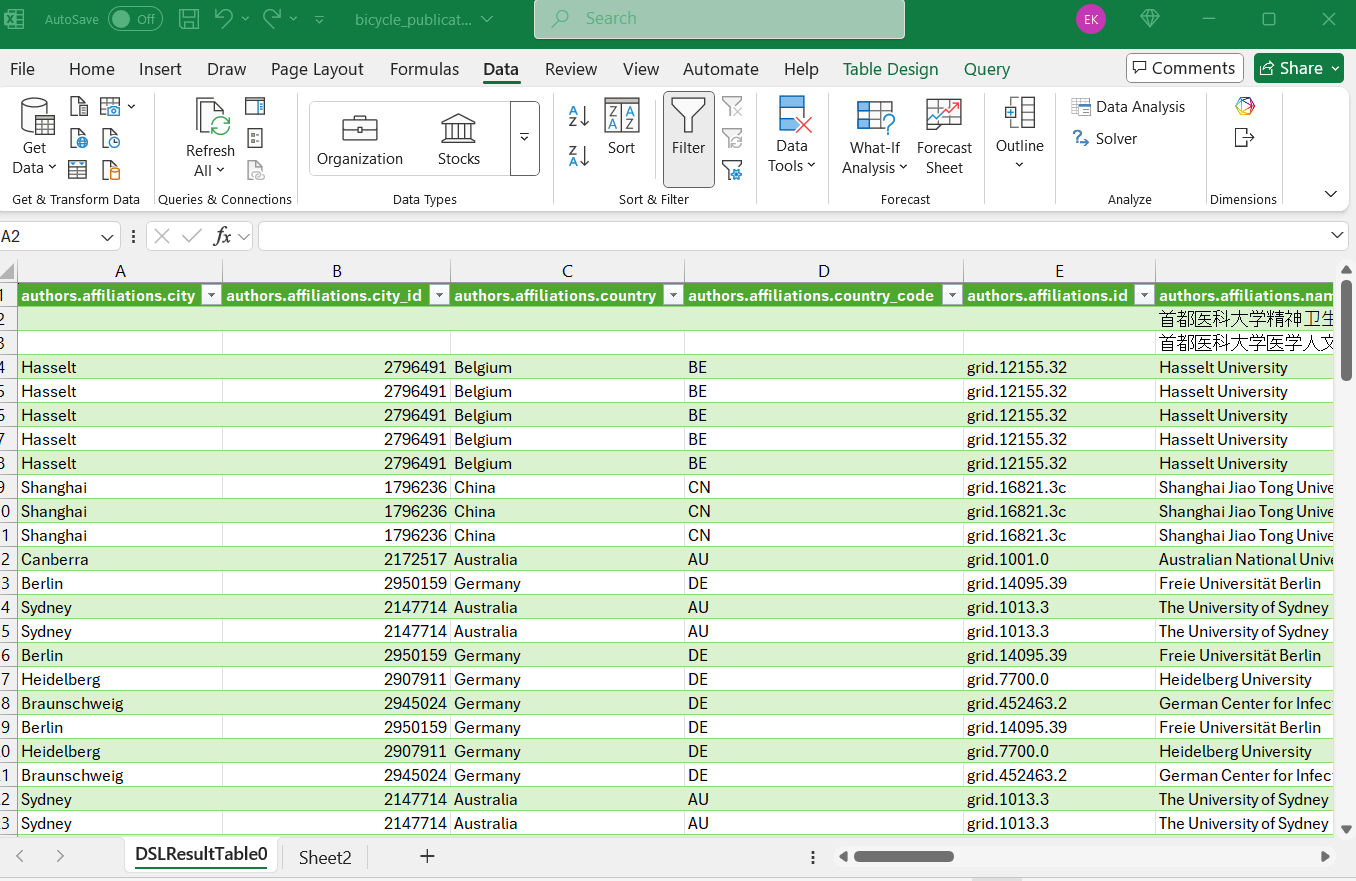
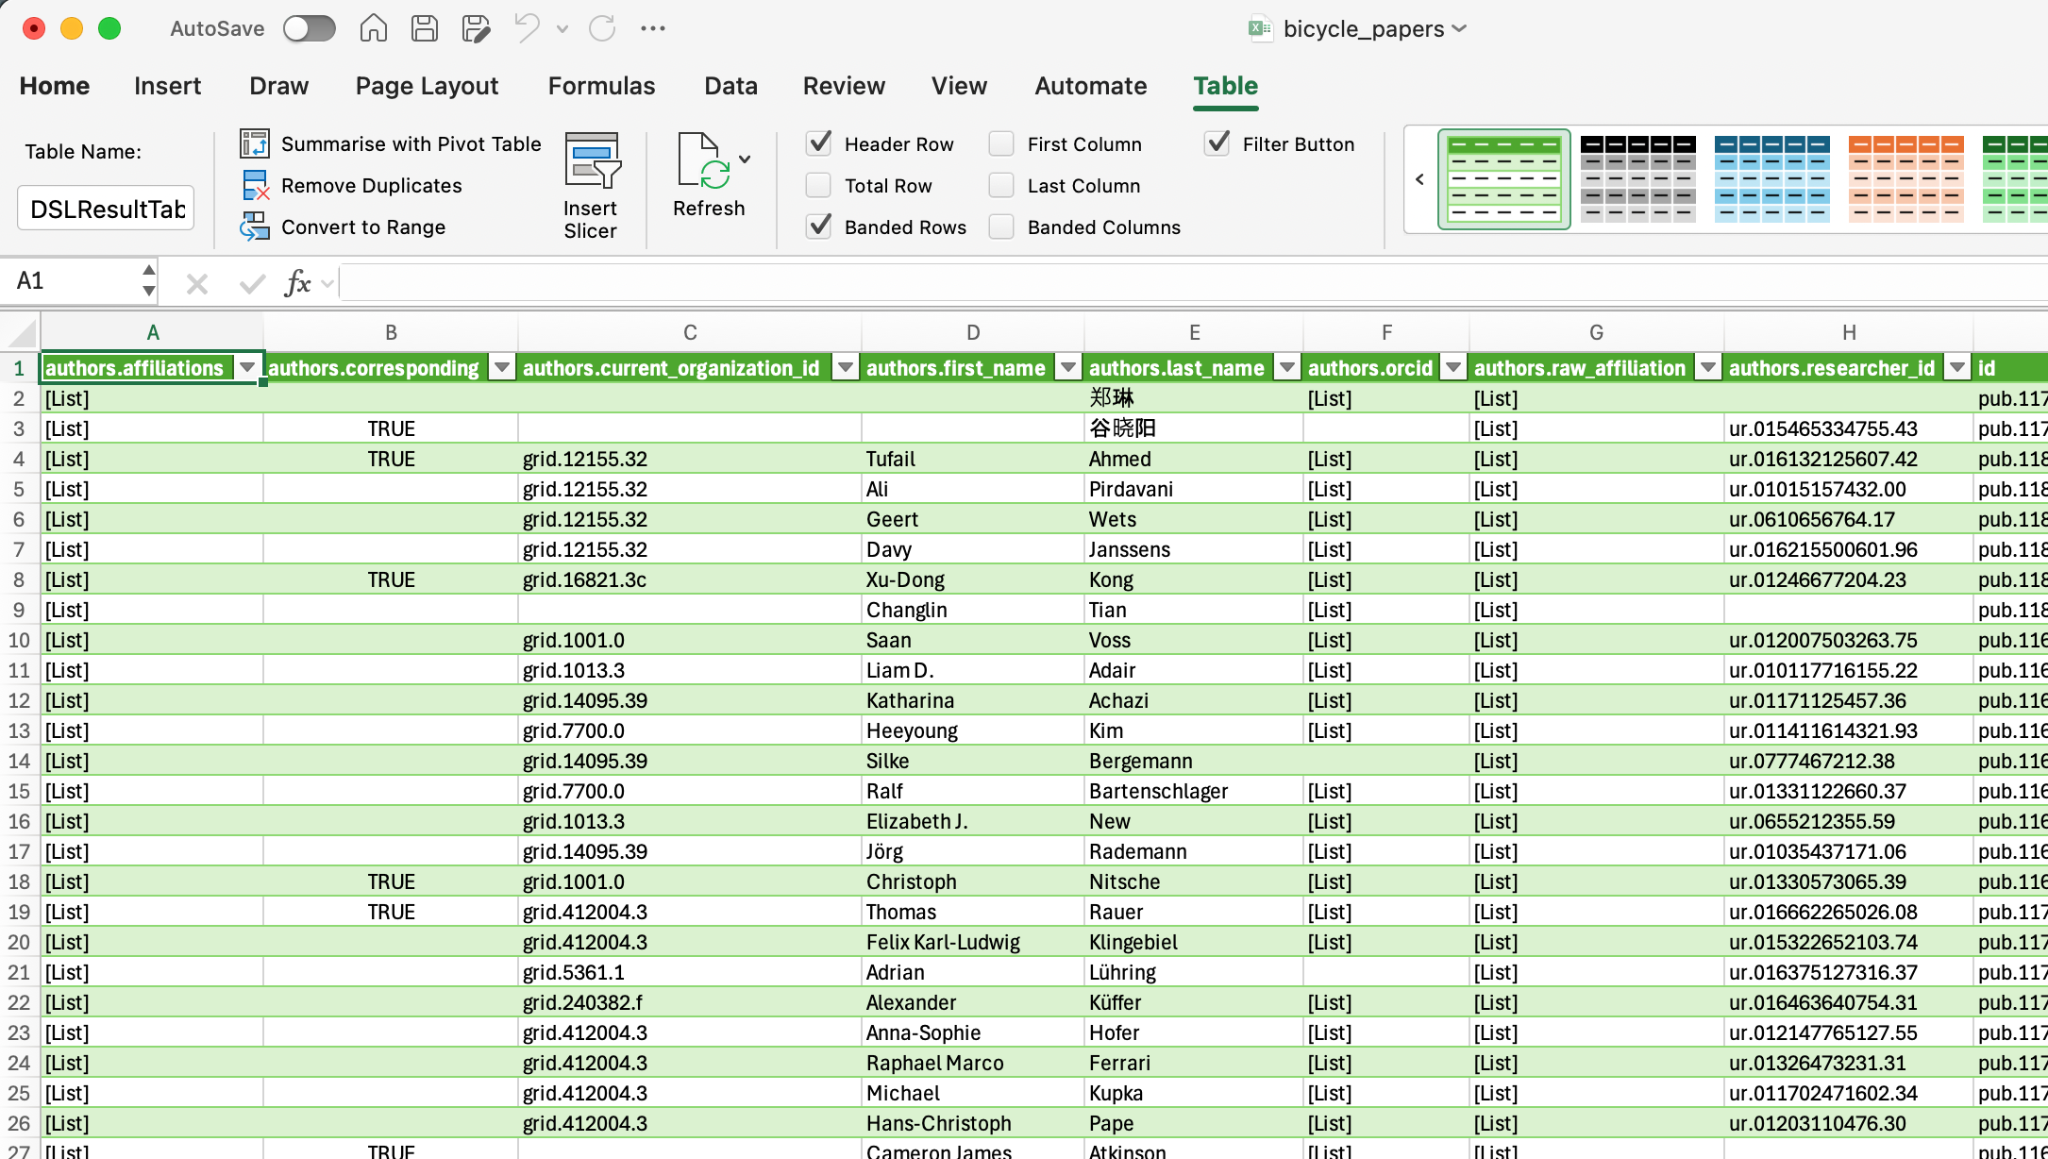
The column becomes a [List] (for arrays) or [Record] (for objects). Click the Expand (two diverging arrows) to give each list item its own row.
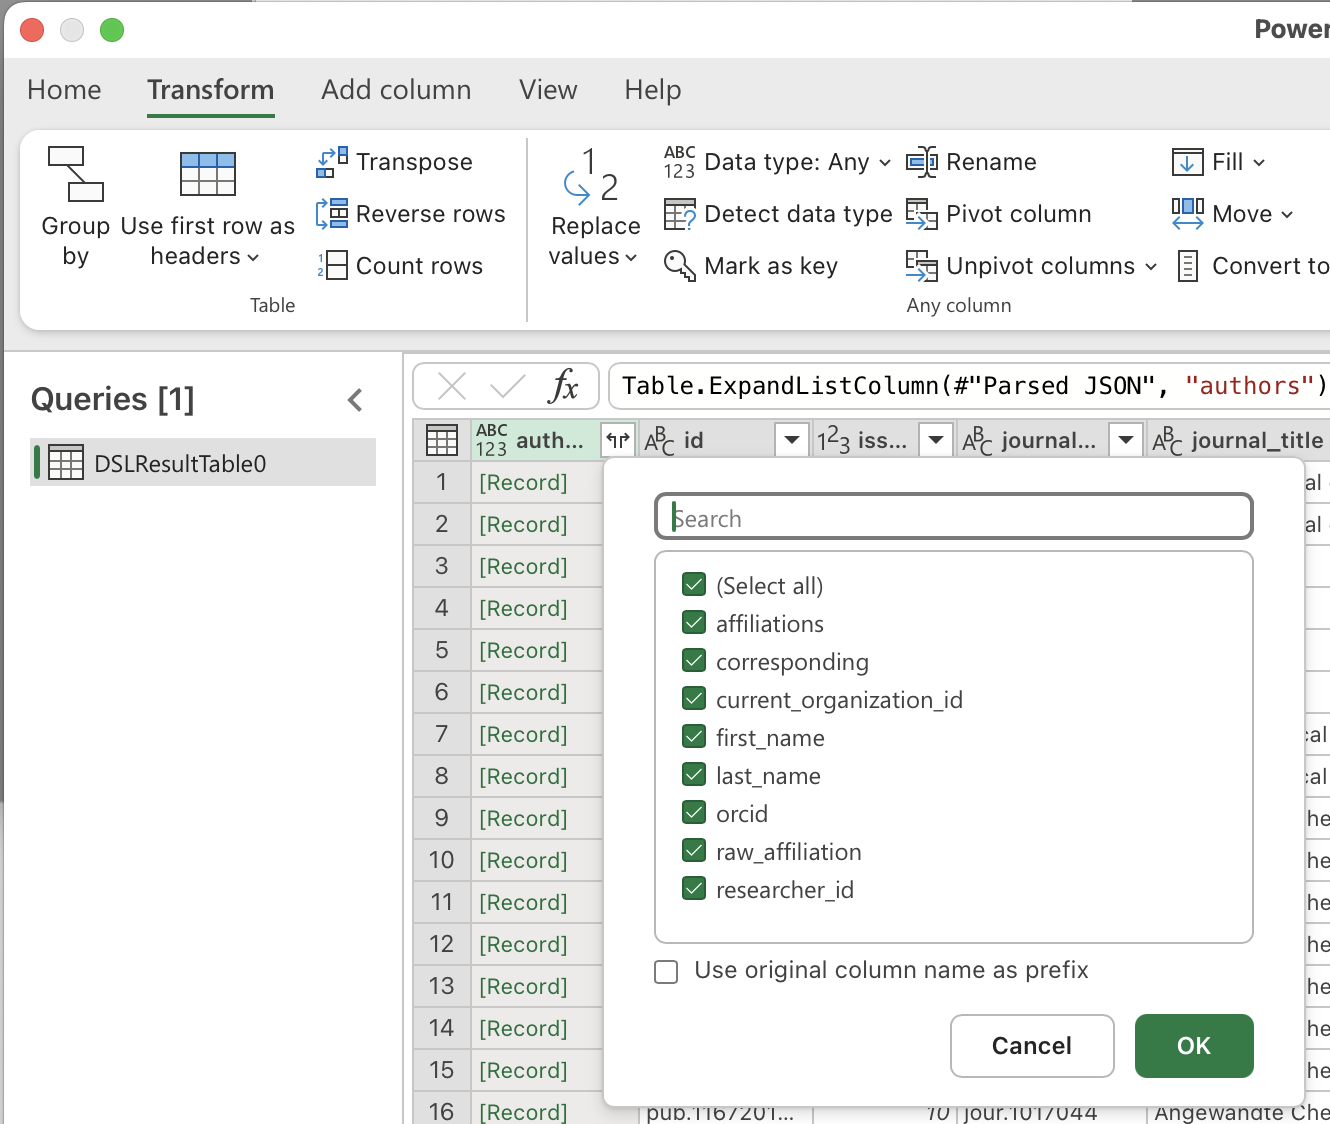
After expanding lists, you may see Record values. Click Expand again to split fields into columns.
Tip
Check Use original column name as prefix to avoid name collisions.
Repeat expansions only where useful. Nested JSON can yield additional [List] or [Record] columns.
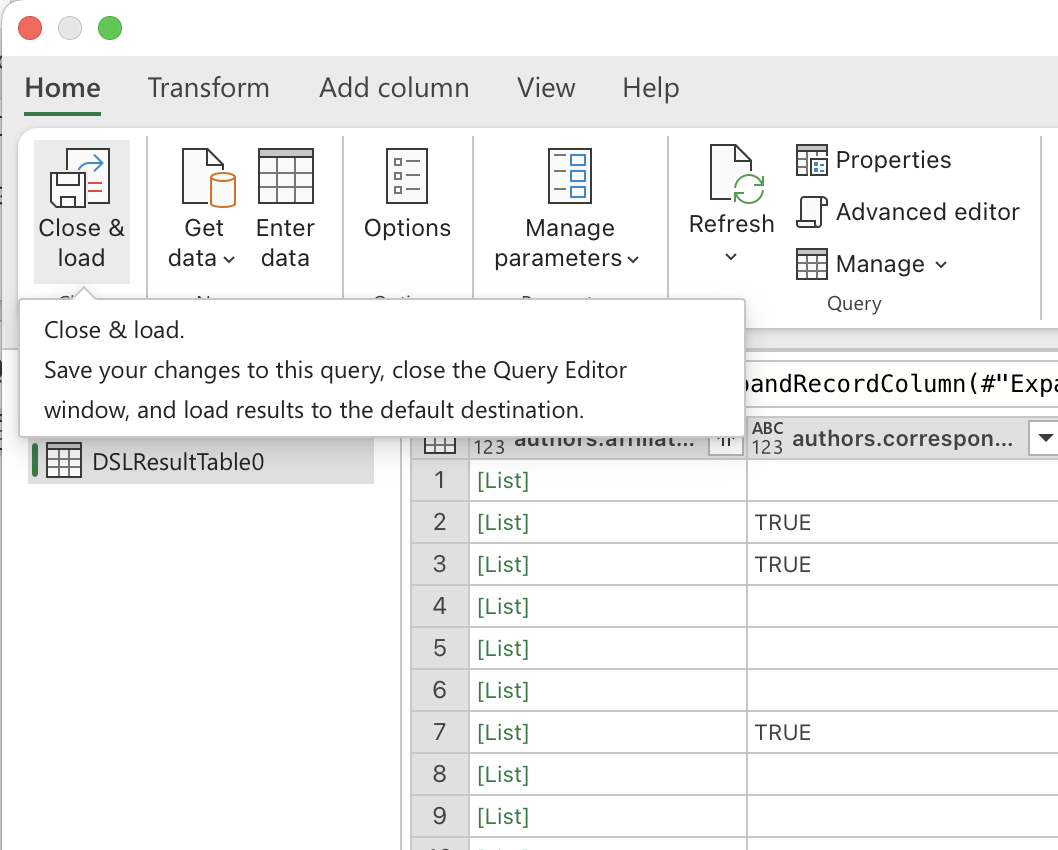
Close & Load
When finished, click Close & Load (Home ribbon) to load the transformed data back into Excel.
Full Walkthrough Screenshots (in order)
The following images continue the complete, sequential visual walkthrough. Use them as needed in your docs or replace any of the earlier screenshots if they match your UI better.
Conclusion
You’ve unpacked and normalized JSON data in Excel using Power Query. The data is now ready for analysis with PivotTables and standard formulas.